
Figure 1
- ID
- ZDB-FIG-230110-27
- Publication
- Alannan et al., 2022 - Targeting PCSK9 in Liver Cancer Cells Triggers Metabolic Exhaustion and Cell Death by Ferroptosis
- Other Figures
- All Figure Page
- Back to All Figure Page
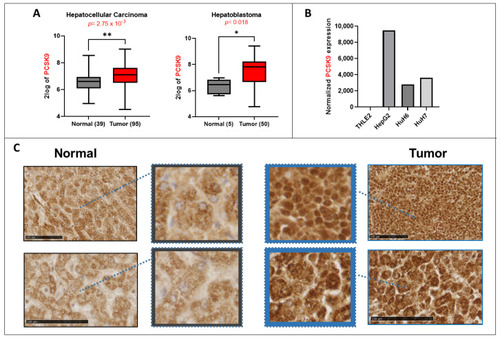
Lipid metabolism in liver cancer. (A) PCSK9 gene expression upregulation in 2 transcriptomic datasets generated from the R2: Genomics Analysis and Visualization Platform (http://r2.amc.nl, accessed on 23 September 2022). Left histogram, hepatocellular carcinoma (HCC): Wu—134—MAS 5.0—u133p2. Right histogram, hepatoblastoma (HB): López-Terrada—55-fRMA—u133p2. Unpaired t-test, * p < 0.05; ** p < 0.01. (B) Normalized gene expression of PCSK9 in three liver cancer cell lines (HepG2, Huh6 and Huh7) and one normal cell line (TLHE2). (C) PCSK9 staining of HB tumoral tissues was compared to normal liver tissues from the same patients. PCSK9 immunostaining of the whole tissue sections is shown in included subsets in which blue squares and arrows indicate the depicted enlarged area of staining. Samples were collected as described in the Materials and Methods section. The black bars represent 100 µm |