
- Title
-
Targeting PCSK9 in Liver Cancer Cells Triggers Metabolic Exhaustion and Cell Death by Ferroptosis
- Authors
- Alannan, M., Fatrouni, H., Trézéguet, V., Dittrich-Domergue, F., Moreau, P., Siegfried, G., Liet, B., Khatib, A.M., Grosset, C.F., Badran, B., Fayyad-Kazan, H., Merched, A.J.
- Source
- Full text @ Cells
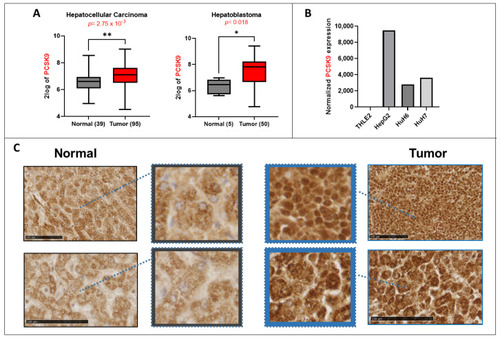
Lipid metabolism in liver cancer. (A) PCSK9 gene expression upregulation in 2 transcriptomic datasets generated from the R2: Genomics Analysis and Visualization Platform (http://r2.amc.nl, accessed on 23 September 2022). Left histogram, hepatocellular carcinoma (HCC): Wu—134—MAS 5.0—u133p2. Right histogram, hepatoblastoma (HB): López-Terrada—55-fRMA—u133p2. Unpaired t-test, * p < 0.05; ** p < 0.01. (B) Normalized gene expression of PCSK9 in three liver cancer cell lines (HepG2, Huh6 and Huh7) and one normal cell line (TLHE2). (C) PCSK9 staining of HB tumoral tissues was compared to normal liver tissues from the same patients. PCSK9 immunostaining of the whole tissue sections is shown in included subsets in which blue squares and arrows indicate the depicted enlarged area of staining. Samples were collected as described in the Materials and Methods section. The black bars represent 100 µm |
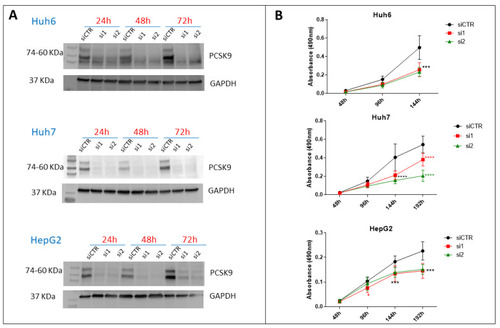
Effect of PCSK9 silencing by siRNA on liver cancer cell proliferation. (A) Validation of the depletion of PCSK9 by siRNA silencing. Cell extracts were prepared 24, 48 and 72 h after transfection with a control siRNA (siCTR) or targeting PCSK9 (si1 and si2) of Huh6, Huh7 or HepG2 cells. A total of 40 µg of cell proteins were loaded per lane on an SDS-PAGE. After electrophoresis and transfer, the membrane was analyzed by Western blot using anti-PCSK9 and GAPDH antibodies for comparison of loading. The two bands observed for PCSK9 correspond to the pro-PCSK9 (74 kDa) and cleaved PCSK9 (60 kDa). (B) Evaluation of liver cancer cell proliferation by MTS after transfection with si1 and si2 in comparison with siCTR. Two-way ANOVA test, *** p < 0.001; **** p < 0.0001 (n = 3, with 3 technical replicates within each biological replicate). |
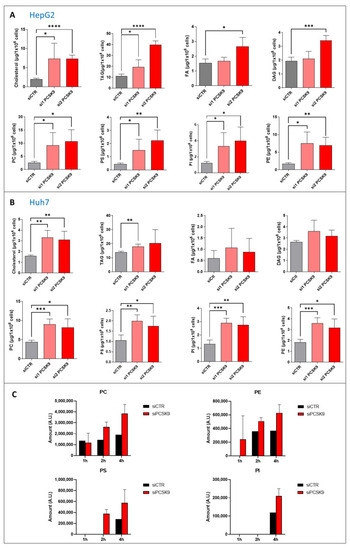
Quantification of neutral lipids and phospholipids after PCSK9 silencing. (A,B) Cholesterol, triacyl glycerol (TAG), fatty acid (FA) diacyl glycerol (DAG), phosphatidylcholine (PC), -serine (PS), -inositol (PI) and -ethanolamine (PE) were measured in (A) HepG2 and (B) Huh7 after transfection with PCSK9 siRNA or the control for 144 h. Unpaired t-test where each siRNA PCSK9 group was compared to the CTR group alone, * p < 0.05; ** p < 0.01; *** p < 0.001; **** p < 0.0001 (n = 3, with 3 technical replicates within each biological replicate). (C) Cells were transfected with siRNA (si1 and si2) for 72 h then fed with [1-14C] acetate. Lipid extraction was performed 1, 2 and 4 h after [1-14C] acetate feeding and radiolabeled PC, PE, PS and PI amounts were measured at each time point. Average values were obtained by combining values from both PCSK9 siRNAs (n = 1, with 3 technical replicates within each condition). |
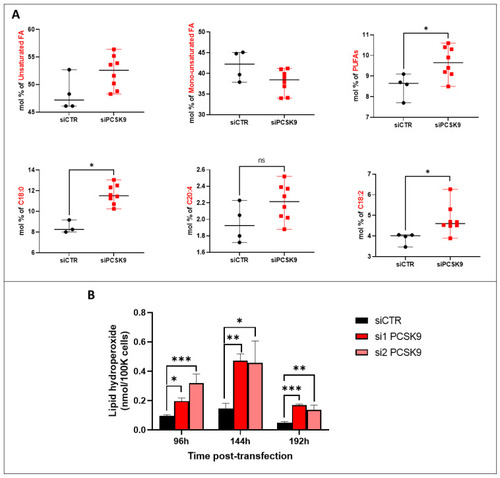
Fatty acid unsaturation and lipid peroxidation after PCSK9 silencing. (A) FA composition and saturation in HepG2 cells silenced or not for PCSK9. Mann–Whitney t-test (n = 3). (B) Lipid hydroperoxide quantification in HepG2 cells after transfection with PCSK9 or control siRNA (si1 and si2 or siCTR) for 96 h, 144 h and 192 h. Quantities are represented in nmol per 100,000 cells. Ordinary one-way ANOVA test. * p < 0.05; ** p < 0.01; *** p < 0.001 (n = 3, with 3 technical replicates within each biological replicate). |
|
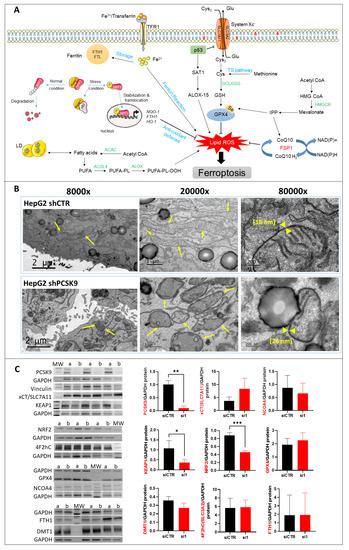
Morphological and molecular features of ferroptosis with PCSK9 deficiency. (A) The central regulator that inhibits ferroptosis is the selenoprotein GPX4, which together with reduced glutathione (GSH), has an antioxidant capacity against lipid reactive oxygen species (ROS), thus blocking ferroptosis (right side). The pathways that lead to the activation and synthesis of GPX4/GSH and hence ferroptosis inhibition include the System Xc--mediated import of cysteine (Cys), production of cysteine by the transsulfuration (TS) pathway and finally, the production of selenocysteine (Se) by the mevalonate pathway. Another important product of the mevalonate pathway is the CoQ10, which can inhibit ferroptosis independently of GPX4. The oxidoreductase FSP1 reduces CoQ10 to ubiquinol (CoQ10 H2) which can trap lipid ROS and then regenerates CoQ10 using NAD(P)H. (left side) The p62/Keap1/Nrf2 pathway plays an important role in inhibiting ferroptosis by activating the expression of antioxidant defense genes NAD(P)H quinone dehydrogenase 1 (NQO-1), FTH-1 and heme oxygenase 1 (HO-1). Under normal conditions, Keap1 binding to Nrf2 induces its ubiquitination and hence proteasome degradation. Under stress conditions, p62 binds to Keap1, the inhibitor of Nrf2, thus stabilizing Nrf2 which can then translocate to the nucleus and induce the expression of antioxidant defense genes. On the other hand, the pathways that lead to lipid ROS accumulation and induction of ferroptosis include: the accumulation of free intracellular ferrous (Fe2+) that can produce hydroxyl and peroxide radicals by the Fenton reaction, hence oxidizing lipids, and tumor protein p53 (p53) activation that inhibits system Xc− uptake of cystine by decreasing the expression of solute carrier family 7 member 11 (SLC7A11), hence affecting GSH/GPX4 antioxidant capacity. It can also activate SAT1 transcription factor to induce lipid peroxidation by increasing ALOX-15 levels; this leads to the production of PUFAs, which are sensitive to lipid peroxidation, resulting in ferroptosis. Abbreviations: ACAC: Acetyl-CoA carboxylase; ACSL4: long-chain fatty Acyl-CoA synthetase 4; Fe3+: ferric cation; FTL: ferritin light chain; GCL: glutamate-cysteine ligase; GSS: glutathione synthetase; HMGCR: 3-hydroxy-3-methylglutaryl-CoA reductase; IPP: isopentenyl pyrophosphate; LD: lipid droplets, PL: phospholipid. (B) TEM photomicrographs of HepG2 cells transduced with PCSK9 shRNA (top panels) and control shRNA (bottom panels) at different magnifications. The arrows point to the mitochondria. The mitochondrial membranes were measured at the higher magnification of 80,000 (between the yellow head arrows) and the results are indicated within brackets. (C) Western blot analyses of proteins involved in different signaling pathways of ferroptosis. Membrane images of each protein and their relative housekeeping genes were combined/fused for comparison purposes. Wells were loaded alternatively with samples from (a) siCTR- and (b) siPCSK9-transfected cells (from left to right). MW stands for molecular weight markers. GAPDH or vinculin were used for protein normalization. Unpaired t-test, * p < 0,05; ** p < 0,01, *** p < 0.001 (n = 3). (D) Histograms showing the percentage of cell growth inhibition induced by siPCSK9 in HepG2 cells normalized to siCTR, which was followed 6 days after treatment with ferrostatin-1 (left panel) and 8 days after treatment with α-tocopherol (right panel). Average values were obtained by combining values from both PCSK9 siRNAs. Unpaired t-test, * p < 0,05 (n = 1, with 3 technical replicates.). 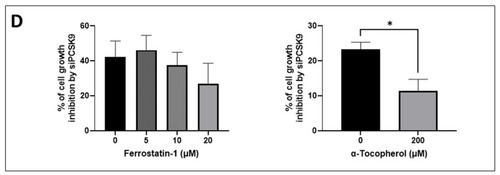
|
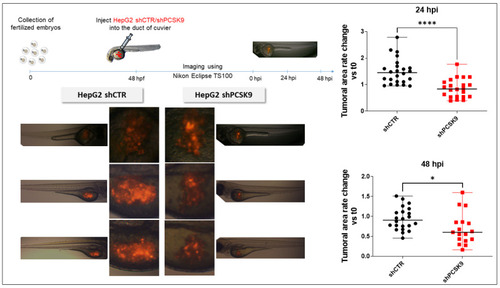
Depleting PCSK9 impairs liver tumor development in vivo. In zebrafish experiments: tomato red fluorescent labeled HepG2 with shPCSK9 or the control were xenografted in zebrafish embryos. Tumoral cell growth was evaluated by the quantification of the fluorescence 24 and 48 h post-injection (hpi). Unpaired t-test, *: p < 0.05, ****: p < 0.0001. |