
FIGURE
Fig. 5
- ID
- ZDB-FIG-221221-27
- Publication
- Lee et al., 2021 - Optimised tissue clearing minimises distortion and destruction during tissue delipidation
- Other Figures
- All Figure Page
- Back to All Figure Page
Fig. 5
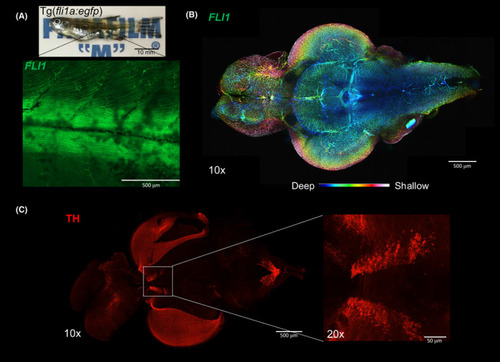
Zebrafish (Danio rerio) imaging after tissue clearing. (A) Whole Tg(fli1a:EGFP) y1 (1.5 years old) after clearing with 4% SDS‐OPTIClear, scale bar = 10 mm. Zoomed‐in 10× image showing EGFP fluorescence in blood vessels. (B)Colour‐coded image labelling the blood vessels in whole zebrafish brain, scale bar = 500 μm. (C) Whole brain immunostained with antibodies against tyrosine hydroxylase, scale bar = 500 μm, higher magnification (20×) showing posterior tuberculum, scale bar = 50 μm |
Expression Data
Expression Detail
Antibody Labeling
Phenotype Data
Phenotype Detail
Acknowledgments
This image is the copyrighted work of the attributed author or publisher, and
ZFIN has permission only to display this image to its users.
Additional permissions should be obtained from the applicable author or publisher of the image.
Full text @ Neuropathol. Appl. Neurobiol.