
Fig. 1
- ID
- ZDB-FIG-221221-23
- Publication
- Lee et al., 2021 - Optimised tissue clearing minimises distortion and destruction during tissue delipidation
- Other Figures
- All Figure Page
- Back to All Figure Page
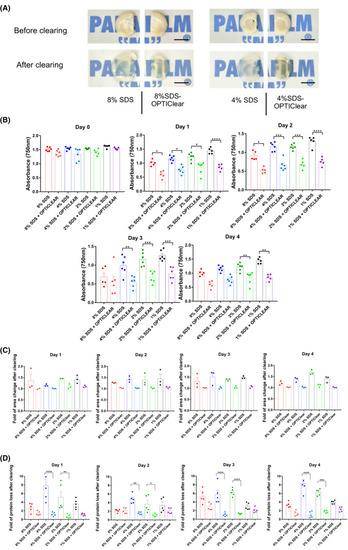
Tissue clearing with different concentrations of SDS vs SDS‐OPTIClear. (A) Representative images of 4 mm‐thick rat brain tissues before and after clearing with SDS and SDS‐OPTIClear respectively. Scale bar = 5 mm. (B) Absorbance at 750 nm for tissues cleared at varying concentrations of SDS vs SDS‐OPTIClear (n = 5–6). Lower absorbance level indicates higher transparency level. (C) Fold of area change after clearing with SDS compared to SDS‐OPTIClear (n = 3). Tissue sizes were quantified and normalised to the size of tissue before clearing. (D) Fold of protein loss after clearing for SDS only compared to SDS‐OPTIClear (n = 5–6). Solutions used for clearing were collected and then added to a stain‐free gel for electrophoresis, band intensities were quantified and normalised with the protein band intensity of sample solution collected at day 0 (before clearing). Mean ± SEM for all graphs. Two‐way ANOVA, Tukey's multiple comparison test, *p ≤ 0.05, **p ≤ 0.01, ***p ≤ 0.001, ****p ≤ 0.0001 |