
Figure 3
- ID
- ZDB-FIG-221214-21
- Publication
- Hess et al., 2022 - Stage-specific and cell type-specific requirements of ikzf1 during haematopoietic differentiation in zebrafish
- Other Figures
- All Figure Page
- Back to All Figure Page
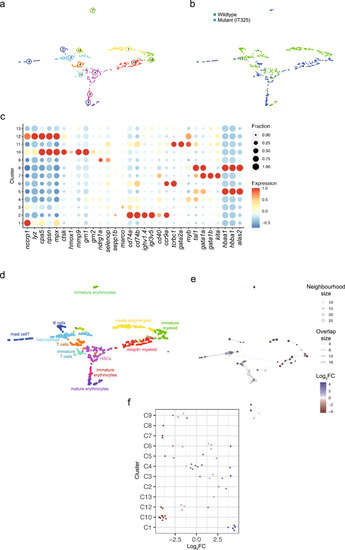
Transcriptional landscape of whole kidney marrow cells of IT325 mutants. (a) Uniform manifold approximation and projection (UMAP) representation of transcriptome similarities determined by combined analysis of 341 wild-type and 331 mutant cells of the IT325 line; the individual clusters are indicated by colour and numbers. (b) Distribution of wild-type and mutant cells among transcriptionally defined cell clusters; genotypes of cells are colour-coded. (c) Expression pattern of signature genes (listed at the bottom) in the individual cell clusters shown in (a, b). Colour represents the z-score of the mean expression of the gene in the respective cluster and dot size represents the fraction of cells in the cluster expressing the gene. z-scores above 1 and below -1 are replaced by 1 and −1, respectively. (d) Cell type identification based on signature gene expression patterns (see Table 2, and text for details). (e) Graph representation of neighbourhoods identified by the Milo algorithm; the positions of index cells of neighbourhoods are projected onto their positions of the UMAP representation shown in (a, b). Nodes are equivalent to neighbourhoods; colours indicate their compositional differences between wildtype and mutant cells and are quantified as log2 fold changes at FDR 10% (colour code is indicated to the right); the sizes of the nodes denote the number of cells in the neighbourhood; graph edges represent the number of cells shared among adjacent neighbourhoods. (f) The distribution of log2 fold changes in abundance between wildtype and mutant cells in neighbourhoods identified in different cell clusters (identified at the left) is shown in a bee-swarm plot; neighbourhoods exhibiting differential abundance at FDR 10% are colour-coded (reddish colours denote greater abundance of mutant cells; bluish colours denote greater abundance of wildtype cells). |