
Figure 2
- ID
- ZDB-FIG-221214-20
- Publication
- Hess et al., 2022 - Stage-specific and cell type-specific requirements of ikzf1 during haematopoietic differentiation in zebrafish
- Other Figures
- All Figure Page
- Back to All Figure Page
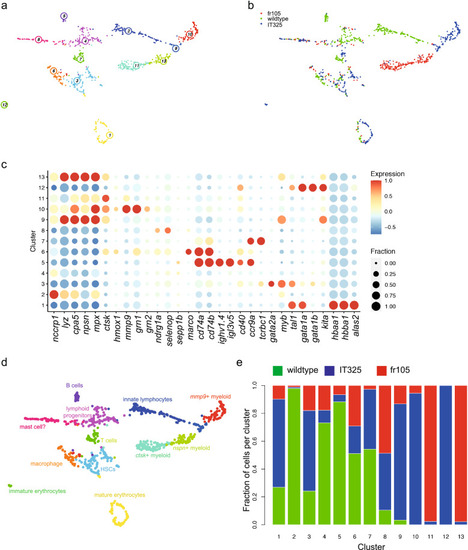
Transcriptional landscape of whole kidney marrow cells of IT325 and fr105 mutants. (a) Uniform manifold approximation and projection (UMAP) representation of transcriptome similarities determined by combined analysis of 341 wild-type, 331 mutant cells of the IT325 line, and 262 mutant cells of the fr105 line; the individual clusters are indicated by colour and numbers. Fish were 3 months of age. (b) Distribution of wild-type and mutant cells among transcriptionally defined cell clusters; origins of cells are colour-coded. (c) Expression pattern of signature genes (listed at the bottom) in the individual cell clusters shown in (a, b). Colour represents the z-score of the mean expression of the gene in the respective cluster and dot size represents the fraction of cells in the cluster expressing the gene. z-scores above 1 and below -1 are replaced by 1 and −1, respectively. (d) Cell type identification based on signature gene expression patterns (see Table 2, and text for details). (e) Distribution of cells of different genotypes in the identified cell clusters. |