FIGURE

Figure 3

ID
ZDB-FIG-221211-23
Publication
Forte-Gomez et al., 2022 - Structure, evolution and expression of zebrafish cartilage oligomeric matrix protein (COMP, TSP5). CRISPR-Cas mutants show a dominant phenotype in myosepta
Other Figures
All Figure Page
Back to All Figure Page
Figure 3

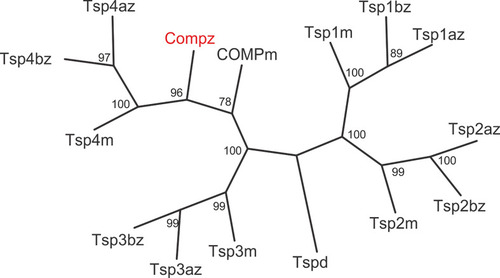
Phylogenetic tree of thrombospondins. Thrombospondin sequences comprising the EGF domains, TSP type-3 repeats and the C-terminal domains from zebrafish (z) and mouse (m) were aligned using the PILEUP program of the GCG package, using the default parameters. As a full-length sequence for zebrafish thrombospondin 1a was not present in the databases, we amplified the lacking N-terminal sequence by RT-PCR (see Supplementary Figure 4). The tree was constructed using the programs PROTEIN DISTANCE, Fitch-Margoliash and CONSENSE of the PHYLIP package version 3.695. Bootstrap analyses using 100 replicates were performed to show the significance. The numbers indicate the statistical weight of the individual branches. Drosophila (d) thrombospondin was used as outgroup.

Expression Data

Expression Detail
Antibody Labeling
Phenotype Data

Phenotype Detail
Acknowledgments
This image is the copyrighted work of the attributed author or publisher, and ZFIN has permission only to display this image to its users. Additional permissions should be obtained from the applicable author or publisher of the image. Full text @ Front Endocrinol (Lausanne)