|
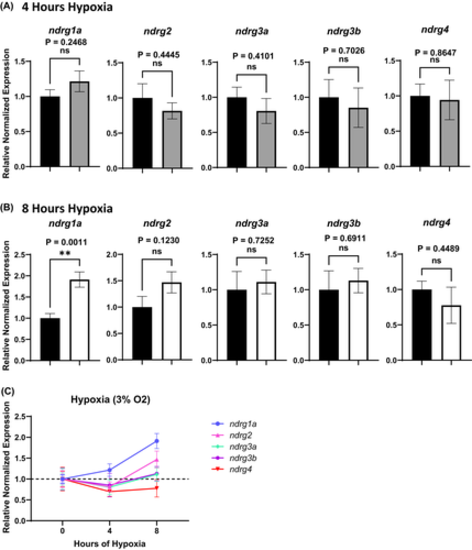
Changes in ndrg transcript levels in response to hypoxia (3% oxygen). (A, B) Real-time qPCR analysis of 24 hpf zebrafish embryos exposed to 4 h (A, grey bars) or 8 h (B, white bars) of hypoxia relative to normoxic (stage-matched) controls (A, B, black bars) normalized to ef1a. (C) Plotted graphical summary of qPCR results. The y-axis in the graphs represents the relative normalized expression of each gene. All fold changes were derived using the formula, 2−(ΔΔCT), error bars represent standard error of the mean. Significance was obtained using the unpaired, two-tailed t-test with Welch’s Correction. **p < .01. Reactions were run in triplicate with 7–8 biological replicates (n = 7–8).
|