
Fig. 4
- ID
- ZDB-FIG-221119-23
- Publication
- Wei et al., 2022 - Anti-infective therapy using species-specific activators of Staphylococcus aureus ClpP
- Other Figures
- All Figure Page
- Back to All Figure Page
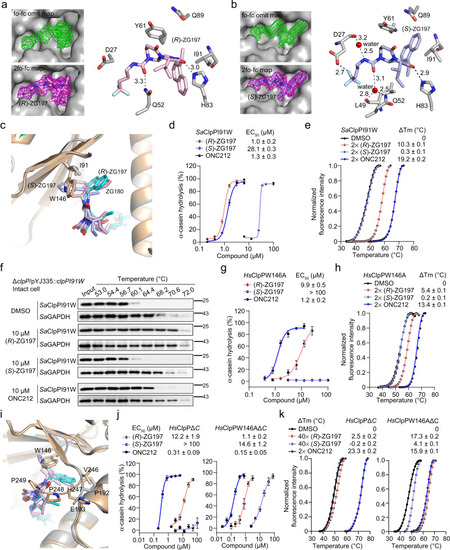
Close view of interactions of (R)- (a) and (S)-ZG197 (b) in the hydrophobic site of SaClpP. The fo-fc omit map for showing (R)- and (S)-ZG197 binding is contoured at 3.0 Å and colored in green, while the 2fo-fc map is contoured at 1.0 Å and colored in magenta, respectively. (R)- and (S)-ZG197 are colored in light pink and light blue, respectively. Hydrogen bonds are indicated by dark dashed lines, and the distance is labeled in Å. c Close view of structural alignments of (R)- and (S)-ZG197 bound to SaClpP complexes, and ZG180 bound to HsClpP in the hydrophobic pockets. ZG180, (R)- and (S)-ZG197 are colored in cyan, light pink, and light blue, respectively. SaClpP is colored in gray, while HsClpP is colored in wheat. d Quantitation of α-casein hydrolysis by the SaClpPI91W mutant in the presence of (R)-ZG197, (S)-ZG197, and ONC212, respectively. e Effect of activators on the thermal stability of the SaClpPI91W protein detected in the DSF assay. f Representative Western blot images showing the effects of 10 μM activators on the thermal denaturation of the SaClpPI91W protein in intact cells of the complemented clpPI91W mutant strain. SaClpPI91W expression was induced in the presence of anhydrous tetracycline (ATC) at 1 ng/mL. Three biological replicates were performed for each experiment. g Quantitation of ClpP activators-promoted hydrolysis of α-casein by the HsClpPW146A mutant. h Effect of activators on the thermal stability of the HsClpPW146A mutant detected in the DSF assay. i Close view of the structural alignment in (c) shows the effect of the C-terminal residues on activators’ binding and activation of HsClpP. j Quantitation of effect of activators-activated α-casein hydrolysis by the HsClpPΔC (left) and HsClpPW146AΔC (right) truncations, respectively. k Effect of activators on the thermal stability of the HsClpPΔC (left) and HsClpPW146AΔC (right) detected in the DSF assay Data (d, e, g, h, j, and k) are obtained from three biologically independent experiments and presented as mean ± SD (error bars). Source data are provided as a Source Data file. |