
- Title
-
Anti-infective therapy using species-specific activators of Staphylococcus aureus ClpP
- Authors
- Wei, B., Zhang, T., Wang, P., Pan, Y., Li, J., Chen, W., Zhang, M., Ji, Q., Wu, W., Lan, L., Gan, J., Yang, C.G.
- Source
- Full text @ Nat. Commun.

a The goal of this work is to develop selective SaClpP activators. b The synthetic lead compound ZG180 as ClpP activator. c Quantitation of α-casein hydrolysis by SaClpP and HsClpP in the presence of ICG-001 and ZG180, respectively (n = 3 biologically independent experiments). Data are presented as mean ± SD (error bars). X-ray crystal structure of ZG180/SaClpP (d) and ZG180/HsClpP (e) complexes. Side and top views of the structural complexes are displayed. SaClpP is shown in gray cartoon tube, HsClpP is shown in wheat cartoon tube, and ZG180 is shown in cyan sphere. f, g The electron density maps and close view of ZG180 binding in the hydrophobic pockets of SaClpP (f) and HsClpP (g). The fo-fc omit map is contoured at 3.0 Å and colored in green, while the 2fo-fc map is contoured at 1.0 Å and colored in magenta. ZG180 is shown in cyan stick. Hydrogen bonds are indicated with dark dashed lines, and the distance in Å is labeled. Source data are provided as a Source Data file. |
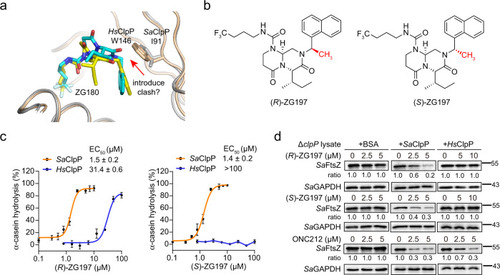
a Structural superimposition of ZG180/SaClpP and ZG180/HsClpP complexes to reveal the strategy for designing selective activators for SaClpP over HsClpP. SaClpP and HsClpP are shown in gray and wheat cartoon tubes, respectively. ZG180 is colored in cyan in the ZG180/SaClpP structure, while it is colored in yellow in the ZG180/HsClpP structure. I91 in SaClpP and W146 in HsClpP are shown as a stick. b Structures of SaClpP activators (R)- and (S)-ZG197 developed by the structure-based design outlined in (a). The chiral methyl group is indicated in red. c Quantitation of α-casein hydrolysis by SaClpP and HsClpP in the presence of (R)- and (S)-ZG197, respectively (n = 3 biologically independent experiments). Data are presented as mean ± SD (error bars). d Effect of activators on degradation of the cellular SaFtsZ protein with the supplement of bovine serum albumin (BSA), the recombinant SaClpP, and HsClpP, respectively, in cell lysates of the clpP deletion (ΔclpP) mutant. The abundance of cellular SaFtsZ is quantitated with a Western blot assay. Quantitation on the band intensity of SaFtsZ is normalized against the loading control of SaGAPDH, and the ratio in the DMSO group is considered as 1.0. Source data are provided as a Source Data file. |

Effect of (R)- (a) and (S)-ZG197 (b) on the thermal stability of SaClpP and HsClpP in DSF assay, respectively. Tm, melting temperature. c Determination of (R)- and (S)-ZG197 binding to SaClpP by ITC titration. The dissociation constant (Kd) and stoichiometry factor (N) are indicated. Effect of activators on the thermal stability of the cellular SaClpP (d) and HsClpP (e), respectively. The S. aureus 8325-4 was cultured in the presence of 10 μM compound for 2 h before running CETSA (d), while cell lysates of HEK 293 T/17 were assayed in CETSA (e). The proteins in unheated samples are used as inputs and considered as 100%. Data (a, b, d, and e) are obtained from three biologically independent experiments and presented as mean ± SD (error bars). Source data are provided as a Source Data file. |
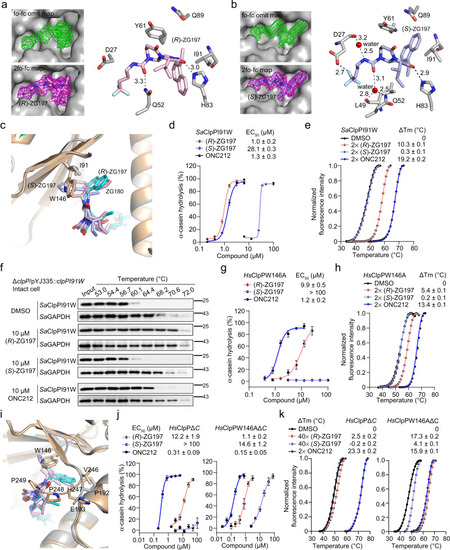
Close view of interactions of (R)- (a) and (S)-ZG197 (b) in the hydrophobic site of SaClpP. The fo-fc omit map for showing (R)- and (S)-ZG197 binding is contoured at 3.0 Å and colored in green, while the 2fo-fc map is contoured at 1.0 Å and colored in magenta, respectively. (R)- and (S)-ZG197 are colored in light pink and light blue, respectively. Hydrogen bonds are indicated by dark dashed lines, and the distance is labeled in Å. c Close view of structural alignments of (R)- and (S)-ZG197 bound to SaClpP complexes, and ZG180 bound to HsClpP in the hydrophobic pockets. ZG180, (R)- and (S)-ZG197 are colored in cyan, light pink, and light blue, respectively. SaClpP is colored in gray, while HsClpP is colored in wheat. d Quantitation of α-casein hydrolysis by the SaClpPI91W mutant in the presence of (R)-ZG197, (S)-ZG197, and ONC212, respectively. e Effect of activators on the thermal stability of the SaClpPI91W protein detected in the DSF assay. f Representative Western blot images showing the effects of 10 μM activators on the thermal denaturation of the SaClpPI91W protein in intact cells of the complemented clpPI91W mutant strain. SaClpPI91W expression was induced in the presence of anhydrous tetracycline (ATC) at 1 ng/mL. Three biological replicates were performed for each experiment. g Quantitation of ClpP activators-promoted hydrolysis of α-casein by the HsClpPW146A mutant. h Effect of activators on the thermal stability of the HsClpPW146A mutant detected in the DSF assay. i Close view of the structural alignment in (c) shows the effect of the C-terminal residues on activators’ binding and activation of HsClpP. j Quantitation of effect of activators-activated α-casein hydrolysis by the HsClpPΔC (left) and HsClpPW146AΔC (right) truncations, respectively. k Effect of activators on the thermal stability of the HsClpPΔC (left) and HsClpPW146AΔC (right) detected in the DSF assay Data (d, e, g, h, j, and k) are obtained from three biologically independent experiments and presented as mean ± SD (error bars). Source data are provided as a Source Data file. |

a Assessment of ClpP activators on the growth of S. aureus 8325-4 with genetic backgrounds of clpP, ΔclpP, and complemented clpP or I91W mutant by MIC measurement. b Assessment of SaClpP activators’ effect on the cellular SaFtsZ abundance in the intact cells of 8325-4, ΔclpP, the complemented clpP and clpPI91W strains detected in Western blot. Quantitation on the band intensity of SaFtsZ is normalized against the loading control of SaGAPDH, and the ratio in the DMSO group is considered as 1.0. c Representative views of SEM micrographs showing the effects of (R)- and (S)-ZG197 on the cell morphology of S. aureus 8325-4 having different genetic backgrounds of clpP, ΔclpP, and complemented clpP or clpPI91W. The scale bar represents 1 μm. d Representative views of SEM micrographs showing the effect of 20 µM (R)- and (S)-ZG197 on cell division of Newman and USA300 strains. The scale bar represents 1 μm. e Determination of MIC of the SaClpP activators against the growth of a panel of S. aureus strains. (R)- and (S)-ZG197, ONC212, and the clinic antibiotics oxacillin, tetracycline, erythromycin, norfloxacin, clindamycin, and gentamicin were assayed under similar conditions. The experiments were performed in triplicates. f Bactericidal effect of (R)- and (S)-ZG197 combined therapy on eradicating stationary phase USA300 (n = 3 biologically independent experiments). Cell numbers were recorded in CFU/mL. Data are presented as mean ± SD. Source data are provided as a Source Data file. |

a Therapeutic effect of (R)- and (S)-ZG197 against USA300 infection in zebrafish. Zebrafish (n = 11 animals) were infected with 7 × 10⁶ CFU of USA300, and compounds were administered at a single dose of 50 mg/kg. DMSO (5%) and vancomycin were administered as controls. Therapeutic effect of (R)-ZG197 against lethal infection by Newman (b) and the ΔclpP mutant (c). Zebrafish (n = 11 animals) were infected with 7 × 10⁷ CFU of Newman (b) or 3 × 10⁷ CFU of the ΔclpP mutant (c), and compounds were administered to infected zebrafish at 50 mg/kg. Vancomycin and ONC212 were used as controls. d Therapeutic effect of (R)-ZG197 on the clinical MRSA isolates infected zebrafish. Zebrafish (n = 11 animals) were infected with 5 × 10⁷ CFU of XJ049, and compounds were administered at a single dose of 50 mg/kg. DMSO (5%), antibiotics (vancomycin, erythromycin, and oxacillin), and the global activator ONC212 were used as controls. e Quantitation of necrotic skin lesion size of initial (left panel) and 4 days post-infection (right panel). Vancomycin was used as a positive control. Data are shown as mean ± SD (n = 9 animals). f Representative images showing necrotic skin lesions 4 days post-infection. The scale bar represents 1 cm. g Effects of our activators on bacterial counts in the skin samples (n = 8 biologically independent samples). Skin tissue was excised from mice infected with USA300 4 days post-infection and plated onto TSA to enumerate CFUs. h Micrographs of H&E-stained skin tissues after the indicated treatments. The scale bar represents 1 mm (Top) and 0.1 mm (Bottom). Statistical differences were analyzed using Log-rank tests (a–d) and two-tailed unpaired Student’s t-tests (e, g). Exact P values are provided. ns, no significance. Data (e, g) are presented as mean ± SD (error bars). Source data are provided as a Source Data file. PHENOTYPE:
|