
Figure 3
- ID
- ZDB-FIG-221104-25
- Publication
- Steib et al., 2022 - TissUExM enables quantitative ultrastructural analysis in whole vertebrate embryos by expansion microscopy
- Other Figures
- All Figure Page
- Back to All Figure Page
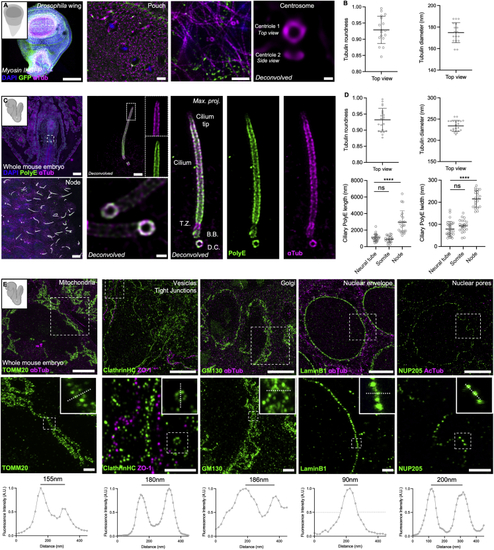
TissUExM is a versatile method for various models and organelles (A) 110 h post-fertilization (hpf) myosin II regulatory light chain-GFP (B) Centrioles in top view. Mean ± SD tubulin roundness: 0.929 ± 0.042. n = 17 centrioles from three independent experiments. Mean ± SD tubulin diameter: 175 ± 9 nm. n = 17 centrioles from three independent experiments. (C) E8.5 whole mouse, stained for PolyE and aTub. DAPI is in blue. Top left: whole embryo (10×); bottom left: node enriched in cilia (10×); top right: maximum projection of a node cilium with inset on the tip (63×); bottom right: maximum projection and deconvolution applied to two cilia with magnification of the cilium base (63×). Right panel shows a BB/cilium complex architecture with subregions such as the TZ and the cilium tip. Scale bars: 100, 1, and 5μm and 200 nm. (D) Centrioles and cilia in top view. Mean ± SD tubulin roundness: 0.932 ± 0.035. n = 22 centrioles from three independent experiments. Mean ± SD tubulin diameter: 234 ± 13 nm. n = 22 centrioles from three independent experiments. Mean ± SD ciliary PolyE length in neural tube: 1,075 ± 411 nm, somite: 899 ± 385 nm, and node 2,956 ± 1,384 nm. n ≥ 20 cilia/tissue from three independent experiments. One-way ANOVA and Kruskal-Wallis ∗∗∗∗p < 0.0001. Mean ± SD ciliary PolyE width in neural tube: 79 ± 33 nm, somite: 93 ± 30 nm, and node: 215 ± 37 nm. n ≥ 20 cilia/tissue from three independent experiments. One-way ANOVA and Kruskal-Wallis ∗∗∗∗p < 0.0001. (E) Organelles in E8.5 mouse. Mitochondria (TOMM20), vesicles (clathrin heavy chain) and tight junctions (ZO1), Golgi apparatus (GM130), nuclear envelope (Lamin B1), and nuclear pore complexes (NUP205). 63×/1.20, Scale bars: 5 and 1 μm. Insets show the regions for fluorescence intensity profiles. Note that no deconvolution was applied. See also |