
- Title
-
TissUExM enables quantitative ultrastructural analysis in whole vertebrate embryos by expansion microscopy
- Authors
- Steib, E., Tetley, R., Laine, R.F., Norris, D.P., Mao, Y., Vermot, J.
- Source
- Full text @ Cell Rep Methods
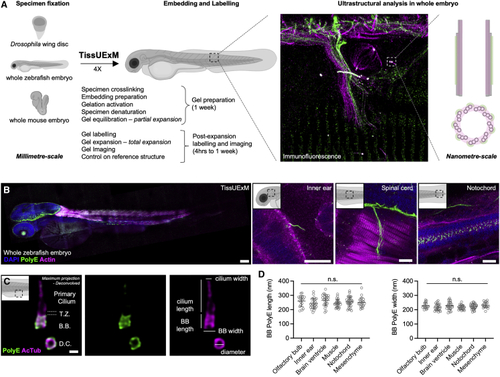
TissUExM allows quantitative super-resolution imaging of endogenous proteins (A) Schematic summary of TissUExM. (B) Two dpf ZF stained for PolyE and Actin. DAPI is in blue. Left to right: whole embryo, inner ear and kinocilium on tether cell, spinal cord and sarcomeres, and notochord with cilia. 10×/0.40, scale bars (gel ExF rescaled): 100, 10, 10, and 10 μm. (C) BB-primary cilium complex in side view, with daughter centriole in top view, stained for PolyE and AcTub. T.Z. stands for transition zone, B.B. for basal body, and D.C. for daughter centriole. Note that PolyE is restricted to the central core of the BB. 63×/1.20, scale bar: 200 nm. (D) BB PolyE in ciliated cells from various tissues. Mean ± SD length in olfactory bulb: 259 ± 38 nm; inner ear: 243 ± 36 nm; brain ventricle: 266 ± 27 nm; muscle: 255 ± 35 nm; notochord: 255 ± 35 nm; and mesenchyme: 251 ± 37 nm. n ≥ 17 BBs/tissue from six independent experiments. Normality by Kolmogorov-Smirnov, one-way ANOVA ns p = 0.1960. Mean ± SD width in olfactory bulb: 228 ± 21 nm; inner ear: 218 ± 22 nm; brain ventricle: 228 ± 28 nm; muscle: 216 ± 15 nm; notochord: 222 ± 19 nm; and mesenchyme: 231 ± 20. n ≥ 17 BBs/tissue from six independent experiments. Normality by Kolmogorov-Smirnov, one-way ANOVA ns p = 0.1104. See also |
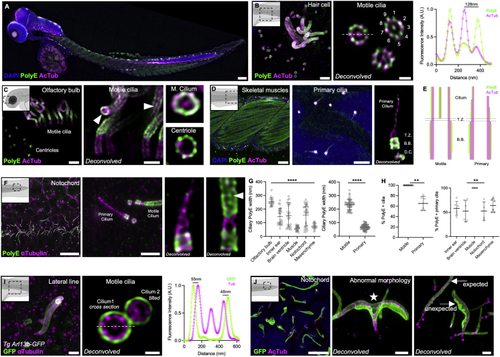
TissUExM reveals tissue specific diversity of ciliary architecture (A) Two dpf ZF stained for PolyE and AcTub. DAPI is in blue. 10×/0.40, scale bar: 100 μm. (B) Hair cell with centrioles and motile cilia, fluorescence intensity profile across the cilium (63X). Scale bars: 1 μm and 200 nm. (C) Olfactory bulb with motile cilia in side view or motile cilium and centriole in top views (63X). White arrow points to the central pair. Scale bars: 1 μm and 500nm. (D) Skeletal muscles (10×) and mesenchyme with insets on primary cilia (63×). Scale bars: 20 μm and 1 μm. (E) Schematic differences between motile and primary cilia axonemes. Pink coverage for tubulin acetylation, and green for polyglutamylation. (F) Notochord of 2 dpf ZF, stained for PolyE and aTub (10×). Inset on region with a PolyE-primary cilium and a PolyE + motile cilium (63×). White arrow points to the central pair. Scale bars: 10 and 1 μm. (G) Tissue-specific ciliary sizes. Mean ± SD ciliary PolyE length in olfactory bulb: 4,095 ± 1,060 nm; inner ear: 1,055 ± 1,498 nm; brain ventricle: 1,612 ± 1,715 nm; muscle: 1,210 ± 406 nm; notochord: 1,798 ± 1,112 nm; and mesenchyme: 1,147 ± 446 nm. n ≥ 17 cilia/tissue from six independent experiments. One-way ANOVA and Kruskal-Wallis ∗∗∗∗p < 0.0001. Mean ± SD ciliary PolyE width in olfactory bulb: 253 ± 31 nm; inner ear: 145 ± 60 nm; brain ventricle: 152 ± 83 nm; muscle: 58 ± 17 nm; notochord: 156 ± 79 nm; and mesenchyme: 76 ± 21 nm. n ≥ 17 cilia/tissue from six independent experiments. One-way ANOVA and Kruskal-Wallis ∗∗∗∗p < 0.0001. Mean ± SD ciliary PolyE width in motile cilia: 233 ± 39 nm versus primary cilia: 66 ± 19 nm. n = 54 motile cilia and n = 78 primary cilia, from six independent experiments. Normality validated by Kolmogorov-Smirnov, Welch t test ∗∗∗∗p < 0.0001. (H) Tissue-specific ciliary polyglutamylation. Mean ± SD percentage of PolyE + motile cilia: 100% ± 0% versus primary cilia: 65% ± 13%. n = 54 motile cilia and n = 78 primary cilia, from six independent experiments. Mann-Whitney ∗∗p = 0.0022. Mean ± SD percentage of PolyE + primary cilia in inner ear 58% ± 14%; brain ventricle: 52% ± 22%; muscle 100% ± 0%; notochord: 52% ± 19%; and mesenchyme: 64% ± 14%. n = 60 cilia/tissue from six independent experiments. One-way ANOVA and Kruskal-Wallis ∗∗p = 0.0042. Mean ± SD percentage of PolyE + primary cilia in various tissues, either co-stained with AcTub, inner ear: 69% ± 9%; brain ventricle: 72% ± 6%; notochord: 69% ± 8%; and mesenchyme 76% ± 4%, or co-stained with aTub, inner ear: 46% ± 6%; brain ventricle: 33% ± 2%; notochord: 36% ± 3%; and mesenchyme: 52% ± 3%. n = 30 cilia/tissue from three independent experiments. One-way ANOVA with multiple comparison ∗∗∗∗p < 0.0001. Kruskal-Wallis ns p = 0.7777 on AcTub primary cilia and ∗∗p = 0.0030 on aTub primary cilia ∗∗p = 0.0030. (I and J) Two dpf Arl13B-GFP ZF. (I) Hair cell stained for GFP and aTub. Inset on perfect top view across a motile cilium, with fluorescence intensity profile. 63×/1.20, scale bars: 1 μm and 200 nm. (J) Notochord (10×), stained for GFP and AcTub. Insets on abnormal cilia (63×) with white star for axonemal bifurcation and white arrows showing ultrastructural differences with ciliary membrane accumulation. Scale bars: 5, 1, and 1 μm. See also |
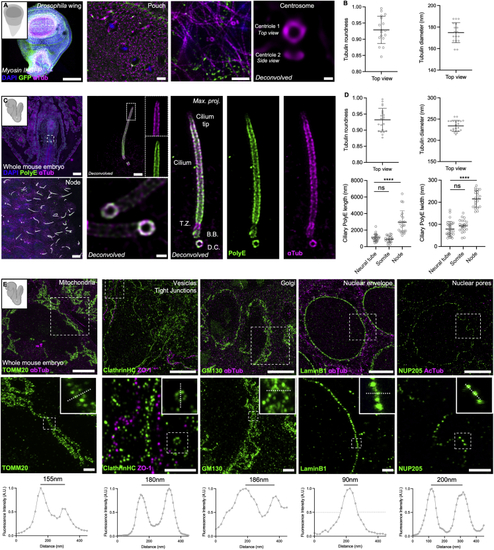
TissUExM is a versatile method for various models and organelles (A) 110 h post-fertilization (hpf) myosin II regulatory light chain-GFP (B) Centrioles in top view. Mean ± SD tubulin roundness: 0.929 ± 0.042. n = 17 centrioles from three independent experiments. Mean ± SD tubulin diameter: 175 ± 9 nm. n = 17 centrioles from three independent experiments. (C) E8.5 whole mouse, stained for PolyE and aTub. DAPI is in blue. Top left: whole embryo (10×); bottom left: node enriched in cilia (10×); top right: maximum projection of a node cilium with inset on the tip (63×); bottom right: maximum projection and deconvolution applied to two cilia with magnification of the cilium base (63×). Right panel shows a BB/cilium complex architecture with subregions such as the TZ and the cilium tip. Scale bars: 100, 1, and 5μm and 200 nm. (D) Centrioles and cilia in top view. Mean ± SD tubulin roundness: 0.932 ± 0.035. n = 22 centrioles from three independent experiments. Mean ± SD tubulin diameter: 234 ± 13 nm. n = 22 centrioles from three independent experiments. Mean ± SD ciliary PolyE length in neural tube: 1,075 ± 411 nm, somite: 899 ± 385 nm, and node 2,956 ± 1,384 nm. n ≥ 20 cilia/tissue from three independent experiments. One-way ANOVA and Kruskal-Wallis ∗∗∗∗p < 0.0001. Mean ± SD ciliary PolyE width in neural tube: 79 ± 33 nm, somite: 93 ± 30 nm, and node: 215 ± 37 nm. n ≥ 20 cilia/tissue from three independent experiments. One-way ANOVA and Kruskal-Wallis ∗∗∗∗p < 0.0001. (E) Organelles in E8.5 mouse. Mitochondria (TOMM20), vesicles (clathrin heavy chain) and tight junctions (ZO1), Golgi apparatus (GM130), nuclear envelope (Lamin B1), and nuclear pore complexes (NUP205). 63×/1.20, Scale bars: 5 and 1 μm. Insets show the regions for fluorescence intensity profiles. Note that no deconvolution was applied. See also |