
Figure 1
- ID
- ZDB-FIG-221104-23
- Publication
- Steib et al., 2022 - TissUExM enables quantitative ultrastructural analysis in whole vertebrate embryos by expansion microscopy
- Other Figures
- All Figure Page
- Back to All Figure Page
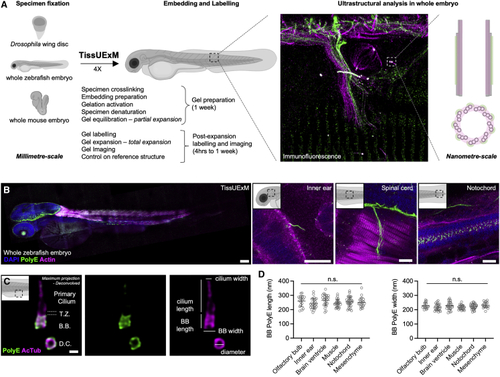
TissUExM allows quantitative super-resolution imaging of endogenous proteins (A) Schematic summary of TissUExM. (B) Two dpf ZF stained for PolyE and Actin. DAPI is in blue. Left to right: whole embryo, inner ear and kinocilium on tether cell, spinal cord and sarcomeres, and notochord with cilia. 10×/0.40, scale bars (gel ExF rescaled): 100, 10, 10, and 10 μm. (C) BB-primary cilium complex in side view, with daughter centriole in top view, stained for PolyE and AcTub. T.Z. stands for transition zone, B.B. for basal body, and D.C. for daughter centriole. Note that PolyE is restricted to the central core of the BB. 63×/1.20, scale bar: 200 nm. (D) BB PolyE in ciliated cells from various tissues. Mean ± SD length in olfactory bulb: 259 ± 38 nm; inner ear: 243 ± 36 nm; brain ventricle: 266 ± 27 nm; muscle: 255 ± 35 nm; notochord: 255 ± 35 nm; and mesenchyme: 251 ± 37 nm. n ≥ 17 BBs/tissue from six independent experiments. Normality by Kolmogorov-Smirnov, one-way ANOVA ns p = 0.1960. Mean ± SD width in olfactory bulb: 228 ± 21 nm; inner ear: 218 ± 22 nm; brain ventricle: 228 ± 28 nm; muscle: 216 ± 15 nm; notochord: 222 ± 19 nm; and mesenchyme: 231 ± 20. n ≥ 17 BBs/tissue from six independent experiments. Normality by Kolmogorov-Smirnov, one-way ANOVA ns p = 0.1104. See also |