
Figure 2
- ID
- ZDB-FIG-221104-24
- Publication
- Steib et al., 2022 - TissUExM enables quantitative ultrastructural analysis in whole vertebrate embryos by expansion microscopy
- Other Figures
- All Figure Page
- Back to All Figure Page
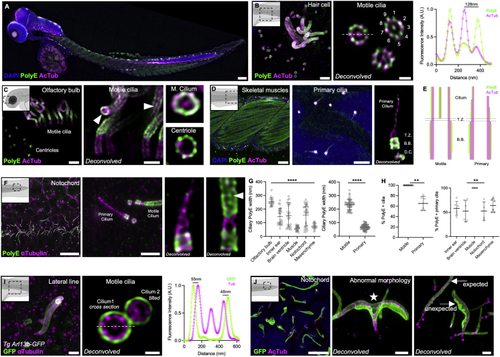
TissUExM reveals tissue specific diversity of ciliary architecture (A) Two dpf ZF stained for PolyE and AcTub. DAPI is in blue. 10×/0.40, scale bar: 100 μm. (B) Hair cell with centrioles and motile cilia, fluorescence intensity profile across the cilium (63X). Scale bars: 1 μm and 200 nm. (C) Olfactory bulb with motile cilia in side view or motile cilium and centriole in top views (63X). White arrow points to the central pair. Scale bars: 1 μm and 500nm. (D) Skeletal muscles (10×) and mesenchyme with insets on primary cilia (63×). Scale bars: 20 μm and 1 μm. (E) Schematic differences between motile and primary cilia axonemes. Pink coverage for tubulin acetylation, and green for polyglutamylation. (F) Notochord of 2 dpf ZF, stained for PolyE and aTub (10×). Inset on region with a PolyE-primary cilium and a PolyE + motile cilium (63×). White arrow points to the central pair. Scale bars: 10 and 1 μm. (G) Tissue-specific ciliary sizes. Mean ± SD ciliary PolyE length in olfactory bulb: 4,095 ± 1,060 nm; inner ear: 1,055 ± 1,498 nm; brain ventricle: 1,612 ± 1,715 nm; muscle: 1,210 ± 406 nm; notochord: 1,798 ± 1,112 nm; and mesenchyme: 1,147 ± 446 nm. n ≥ 17 cilia/tissue from six independent experiments. One-way ANOVA and Kruskal-Wallis ∗∗∗∗p < 0.0001. Mean ± SD ciliary PolyE width in olfactory bulb: 253 ± 31 nm; inner ear: 145 ± 60 nm; brain ventricle: 152 ± 83 nm; muscle: 58 ± 17 nm; notochord: 156 ± 79 nm; and mesenchyme: 76 ± 21 nm. n ≥ 17 cilia/tissue from six independent experiments. One-way ANOVA and Kruskal-Wallis ∗∗∗∗p < 0.0001. Mean ± SD ciliary PolyE width in motile cilia: 233 ± 39 nm versus primary cilia: 66 ± 19 nm. n = 54 motile cilia and n = 78 primary cilia, from six independent experiments. Normality validated by Kolmogorov-Smirnov, Welch t test ∗∗∗∗p < 0.0001. (H) Tissue-specific ciliary polyglutamylation. Mean ± SD percentage of PolyE + motile cilia: 100% ± 0% versus primary cilia: 65% ± 13%. n = 54 motile cilia and n = 78 primary cilia, from six independent experiments. Mann-Whitney ∗∗p = 0.0022. Mean ± SD percentage of PolyE + primary cilia in inner ear 58% ± 14%; brain ventricle: 52% ± 22%; muscle 100% ± 0%; notochord: 52% ± 19%; and mesenchyme: 64% ± 14%. n = 60 cilia/tissue from six independent experiments. One-way ANOVA and Kruskal-Wallis ∗∗p = 0.0042. Mean ± SD percentage of PolyE + primary cilia in various tissues, either co-stained with AcTub, inner ear: 69% ± 9%; brain ventricle: 72% ± 6%; notochord: 69% ± 8%; and mesenchyme 76% ± 4%, or co-stained with aTub, inner ear: 46% ± 6%; brain ventricle: 33% ± 2%; notochord: 36% ± 3%; and mesenchyme: 52% ± 3%. n = 30 cilia/tissue from three independent experiments. One-way ANOVA with multiple comparison ∗∗∗∗p < 0.0001. Kruskal-Wallis ns p = 0.7777 on AcTub primary cilia and ∗∗p = 0.0030 on aTub primary cilia ∗∗p = 0.0030. (I and J) Two dpf Arl13B-GFP ZF. (I) Hair cell stained for GFP and aTub. Inset on perfect top view across a motile cilium, with fluorescence intensity profile. 63×/1.20, scale bars: 1 μm and 200 nm. (J) Notochord (10×), stained for GFP and AcTub. Insets on abnormal cilia (63×) with white star for axonemal bifurcation and white arrows showing ultrastructural differences with ciliary membrane accumulation. Scale bars: 5, 1, and 1 μm. See also |