
Figure 6
- ID
- ZDB-FIG-221031-107
- Publication
- Yang et al., 2022 - Effects of Dietary Supplementation with Aurantiochytrium sp. on Zebrafish Growth as Determined by Transcriptomics
- Other Figures
- All Figure Page
- Back to All Figure Page
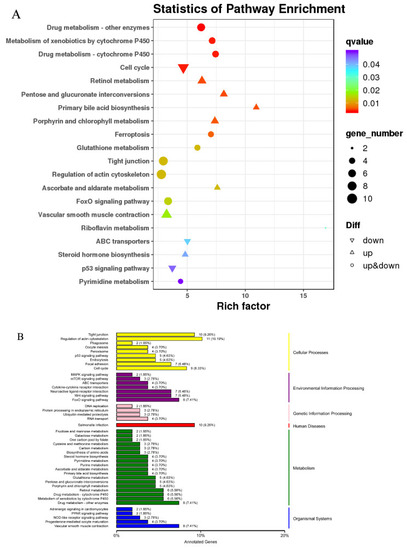
KEGG enrichment and classification. (A) Scatter plot of KEGG pathway enrichment results for differentially expressed genes: the ordinate represents the pathway name, the abscissa represents the enrichment factor, and the color represents the q-value (i.e., the p-value after correction for multiple hypothesis testing). The size of the circle indicates the number of genes involved in the pathway. (B) KEGG classification diagram: the left-hand vertical axis shows the KEGG pathway name, and the right-hand vertical axis shows the category corresponding to each pathway. A shared column color indicates the same category. |