
Figure 2
- ID
- ZDB-FIG-221031-101
- Publication
- Yang et al., 2022 - Effects of Dietary Supplementation with Aurantiochytrium sp. on Zebrafish Growth as Determined by Transcriptomics
- Other Figures
- All Figure Page
- Back to All Figure Page
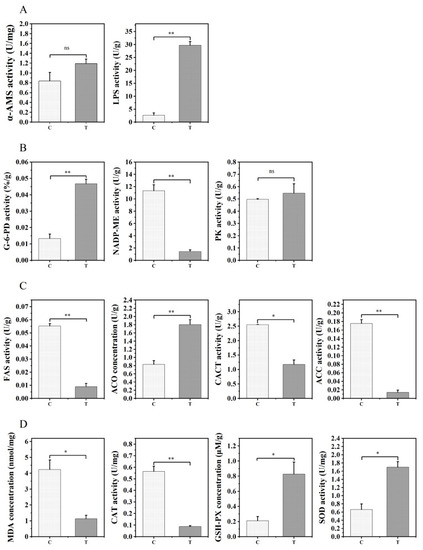
Comparative assessment of liver enzyme activities related to digestion (A), energy metabolism (B), lipid metabolism (C), and antioxidant defense (D) in the control group (C) and 1% TE group (T). Error bars indicate SEM (n = 9). Asterisks indicate significant differences between the two groups (* p < 0.05, ** p < 0.01), ns: not significant (p > 0.05) α-AMS: hepatic amylase; LPS: hepatic lipase; G-6-PD: dehydrogenase; NADP-ME: malic enzyme; PK: pyruvate kinase; FAS: fatty acid synthase; ACO: acetyl-CoA oxidase; CACT: carnitine lipid acyltransferase; ACC: acetyl-CoA; MDA: malondialdehyde; CAT: catalase; GSH–PX: glutathione peroxidase; SOD: superoxide dismutase. |