
|
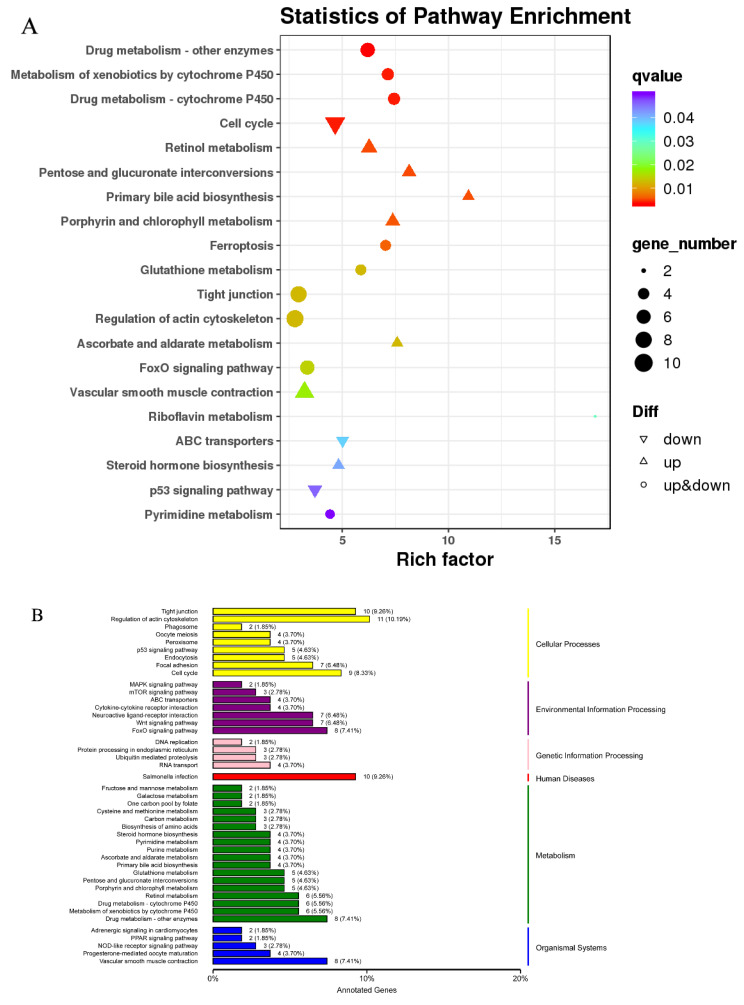
Figure 6 KEGG enrichment and classification. (A) Scatter plot of KEGG pathway enrichment results for differentially expressed genes: the ordinate represents the pathway name, the abscissa represents the enrichment factor, and the color represents the q-value (i.e., the p-value after correction for multiple hypothesis testing). The size of the circle indicates the number of genes involved in the pathway. (B) KEGG classification diagram: the left-hand vertical axis shows the KEGG pathway name, and the right-hand vertical axis shows the category corresponding to each pathway. A shared column color indicates the same category.