
FIGURE
Figure 4
- ID
- ZDB-FIG-221031-103
- Publication
- Yang et al., 2022 - Effects of Dietary Supplementation with Aurantiochytrium sp. on Zebrafish Growth as Determined by Transcriptomics
- Other Figures
- All Figure Page
- Back to All Figure Page
Figure 4
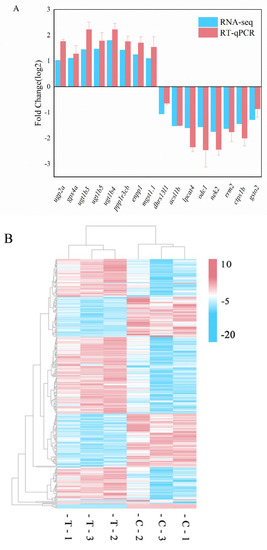
Validation of DEGs and clustering heatmap. (A) Validation of differential expression by RT-qPCR. Error bars indicate SEM (n = 3). (B) Cluster map of gene expression patterns demonstrating general patterns in distinct liver samples. (C) Correlation analysis of log2-fold change values between RNA-Seq data (x-axis) and RT-qPCR data (y-axis). |
Expression Data
Expression Detail
Antibody Labeling
Phenotype Data
Phenotype Detail
Acknowledgments
This image is the copyrighted work of the attributed author or publisher, and
ZFIN has permission only to display this image to its users.
Additional permissions should be obtained from the applicable author or publisher of the image.
Full text @ Animals (Basel)