
|
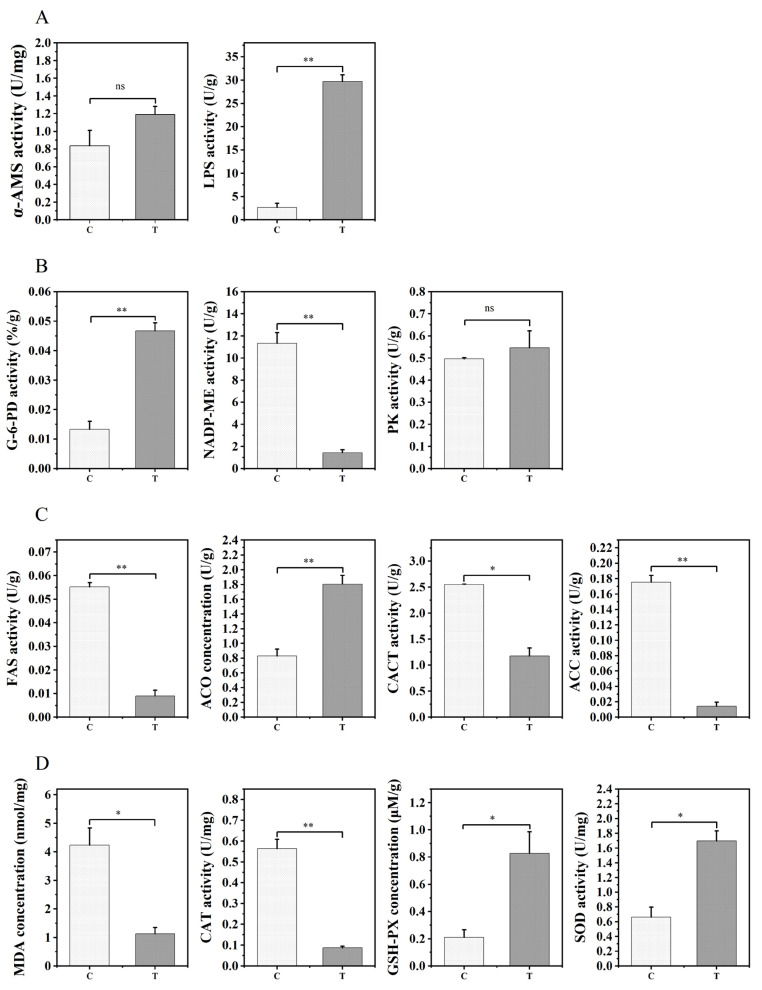
Figure 2
Comparative assessment of liver enzyme activities related to digestion (A), energy metabolism (B), lipid metabolism (C), and antioxidant defense (D) in the control group (C) and 1% TE group (T). Error bars indicate SEM (n = 9). Asterisks indicate significant differences between the two groups (* p < 0.05, ** p < 0.01), ns: not significant (p > 0.05) α-AMS: hepatic amylase; LPS: hepatic lipase; G-6-PD: dehydrogenase; NADP-ME: malic enzyme; PK: pyruvate kinase; FAS: fatty acid synthase; ACO: acetyl-CoA oxidase; CACT: carnitine lipid acyltransferase; ACC: acetyl-CoA; MDA: malondialdehyde; CAT: catalase; GSH–PX: glutathione peroxidase; SOD: superoxide dismutase.