
FIGURE
FIGURE 1
FIGURE 1
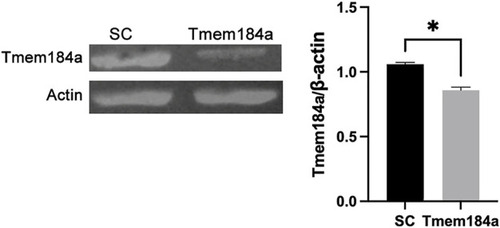
Tmem184a MO Treatment Results in Tmem184a Protein Decrease. Embryos were injected with SC or Tmem184a ATG MO and harvested for western blotting. Three identically treated embryos constituted a single sample. One of three identical experiments is shown with the graph summarizing the data. |
Expression Data
| Gene: | |
|---|---|
| Antibody: | |
| Fish: | |
| Knockdown Reagent: | |
| Anatomical Term: | |
| Stage: | Long-pec |
Expression Detail
Antibody Labeling
Phenotype Data
| Fish: | |
|---|---|
| Knockdown Reagent: | |
| Observed In: | |
| Stage: | Long-pec |
Phenotype Detail
Acknowledgments
This image is the copyrighted work of the attributed author or publisher, and
ZFIN has permission only to display this image to its users.
Additional permissions should be obtained from the applicable author or publisher of the image.
Full text @ Front. Physiol.