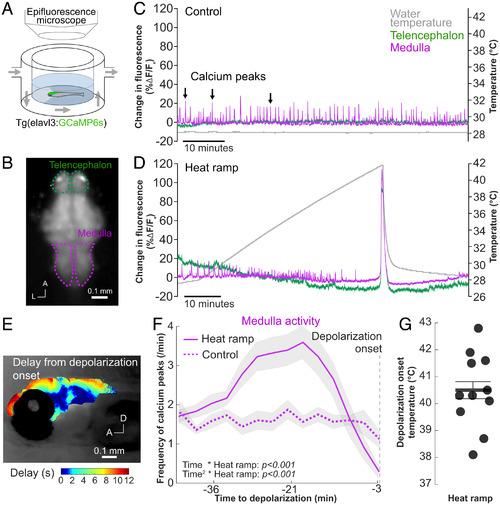
Embedded zebrafish larvae develop brain-wide depolarizations near the upper thermal limit. (A and B) Schematic overview (A) and image (B) of the experimental setup for whole-brain neural activity measurement in agar-embedded, 5-d-old Tg(elavl3:GCaMP6s) zebrafish larva. (B) Raw fluorescence image of the larva brain highlighting the telencephalon (dashed green lines) and medulla (dashed magenta lines). A, anterior; L, lateral. (C and D) Change in fluorescence (% ΔF/F0; left y-axis) in the telencephalon and medulla of a representative control larva (C) and a representative heat-ramp larva (D). The water temperature (gray) was maintained at 28 °C throughout the recording (right y-axis in C) for the control fish and was increased during a heat-ramp treatment (0.3 °C/min) until a brain-wide depolarization was detected and then rapidly adjusted to 28 °C until the end of the recording (right y-axis in D). Note the return to holding temperature in heat-ramp fish and recovery of normal brain activity and calcium peaks 10 to 15 min after the brain-wide depolarization in D. (E) Heat map illustrating the temporal spread of the depolarization throughout the brain in a representative heat-ramp fish mounted laterally (Methods). D, dorsal. (F) Frequency of medulla calcium peaks in heat-ramp fish (n = 11; magenta line) during the 50 min preceding the brain-wide depolarization and during the corresponding period in control fish (n = 8; magenta dashed line) (SI Appendix, Table S4). The depolarization onset in heat-ramp fish is indicated by a dashed vertical line. (G) Temperature at depolarization onset in heat-ramp fish (n = 11). (F and G) Data are presented with mean (solid line) and SE (shaded area) in (F) and with a bar and error bars in (G).
|
