|
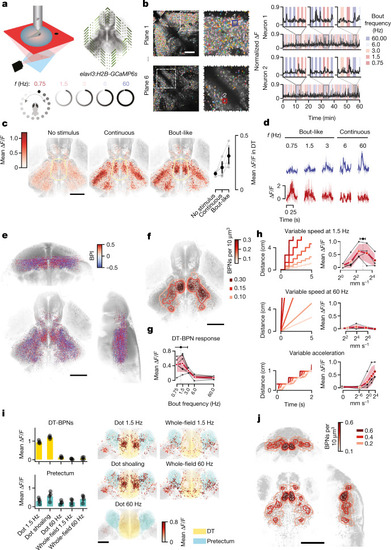
Dorsal thalamus neurons are activated by fish-like motion.a, Schematic of the experimental set-up. b, Example imaging planes in the TeO and DT with all segmented neuronal ROIs, representative for n = 11 animals (left). Right, representative normalized ∆F/F traces of one tectal and one thalamic neuron. c, Horizontal view of all responsive neurons (n = 28,306 total, 2,573 ± 1,175 per fish) from 11 fish (18–22 d.p.f.) aligned to a juvenile reference brain (left). Colour indicates mean baseline ∆F/F (no stimulus), and responses to continuous and bout-like motion. The yellow line indicates the DT. Right, mean responses of all DT neurons per fish (n = 258 ± 198, 2,837 total) from n = 6 animals with a number of recorded DT-BPNs of >30. Data are mean ± 1 s.d. d, Mean ∆F/F responses of example neurons from b to all stimulus frequencies. e, The distribution of all responsive neurons from n = 11 fish in the reference brain. The colour map shows the BPI. Opacity scales with absolute BPI (0–0.5). f, The distribution of BPNs (312 ± 143 neurons per fish, 3,437 total). Colour reflects a Gaussian KDE; contours delineate densities of 0.1, 0.15 and 0.3 BPNs per 1,000 μm3. n = 11 fish. g, DT-BPN tuning to stimulus frequency. The mean peak across neurons was 1.2 Hz ± 1.6 Hz. n = 563 neurons. The black lines represent the mean values of individual animals. Data are from a subset of animals in e with a number of recorded DT-BPNs of >30. n = 6 animals. h, DT-BPN tuning to average speed at 1.5 Hz or 60 Hz and acceleration. The cartoons show stimulus displacement over time. Data are mean ± 1 s.d. of all of the neurons shown above. n = 291 neurons. The black lines indicate individual animals. n = 4 fish, 73 ± 10 neurons per fish. i, DT-BPN and PreT responses to local dot motion and whole-field motion and their anatomical distribution. Circles (left) show the mean of individual animals. n = 4 fish, 77 ± 15 (DT-BPNs), 114 ± 48 (PreT) neurons per fish. Data are mean ± 1 s.d. j, The distribution of BPNs in 7 d.p.f. larvae (n = 4 fish, 230 ± 87 neurons per fish) as in f. Scale bars, 100 μm (b and i) and 200 μm (c, e, f and j). Source data
|