IMAGE

Fig. 2

ID
ZDB-IMAGE-220808-35
Source
Figures for Kappel et al., 2022
Image
Figure Caption

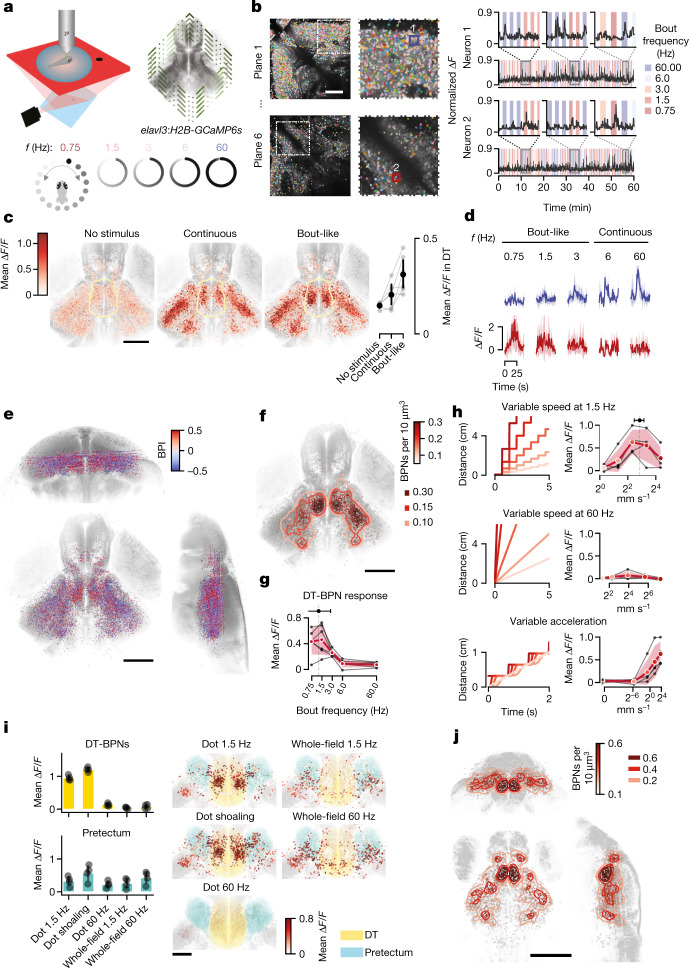
Fig. 2 Dorsal thalamus neurons are activated by fish-like motion.

a, Schematic of the experimental set-up. b, Example imaging planes in the TeO and DT with all segmented neuronal ROIs, representative for n = 11 animals (left). Right, representative normalized ∆F/F traces of one tectal and one thalamic neuron. c, Horizontal view of all responsive neurons (n = 28,306 total, 2,573 ± 1,175 per fish) from 11 fish (18–22 d.p.f.) aligned to a juvenile reference brain (left). Colour indicates mean baseline ∆F/F (no stimulus), and responses to continuous and bout-like motion. The yellow line indicates the DT. Right, mean responses of all DT neurons per fish (n = 258 ± 198, 2,837 total) from n = 6 animals with a number of recorded DT-BPNs of >30. Data are mean ± 1 s.d. d, Mean ∆F/F responses of example neurons from b to all stimulus frequencies. e, The distribution of all responsive neurons from n = 11 fish in the reference brain. The colour map shows the BPI. Opacity scales with absolute BPI (0–0.5). f, The distribution of BPNs (312 ± 143 neurons per fish, 3,437 total). Colour reflects a Gaussian KDE; contours delineate densities of 0.1, 0.15 and 0.3 BPNs per 1,000 μm3. n = 11 fish. g, DT-BPN tuning to stimulus frequency. The mean peak across neurons was 1.2 Hz  ± 1.6 Hz. n = 563 neurons. The black lines represent the mean values of individual animals. Data are from a subset of animals in e with a number of recorded DT-BPNs of >30. n = 6 animals. h, DT-BPN tuning to average speed at 1.5 Hz or 60 Hz and acceleration. The cartoons show stimulus displacement over time. Data are mean ± 1 s.d. of all of the neurons shown above. n = 291 neurons. The black lines indicate individual animals. n = 4 fish, 73 ± 10 neurons per fish. i, DT-BPN and PreT responses to local dot motion and whole-field motion and their anatomical distribution. Circles (left) show the mean of individual animals. n = 4 fish, 77 ± 15 (DT-BPNs), 114 ± 48 (PreT) neurons per fish. Data are mean ± 1 s.d. j, The distribution of BPNs in 7 d.p.f. larvae (n = 4 fish, 230 ± 87 neurons per fish) as in f. Scale bars, 100 μm (b and i) and 200 μm (c, e, f and j).

Source data

Acknowledgments
This image is the copyrighted work of the attributed author or publisher, and ZFIN has permission only to display this image to its users. Additional permissions should be obtained from the applicable author or publisher of the image. Full text @ Nature