
Fig. 6
- ID
- ZDB-FIG-220714-7
- Publication
- Kuromiya et al., 2022 - Calcium sparks enhance the tissue fluidity within epithelial layers and promote apical extrusion of transformed cells
- Other Figures
- All Figure Page
- Back to All Figure Page
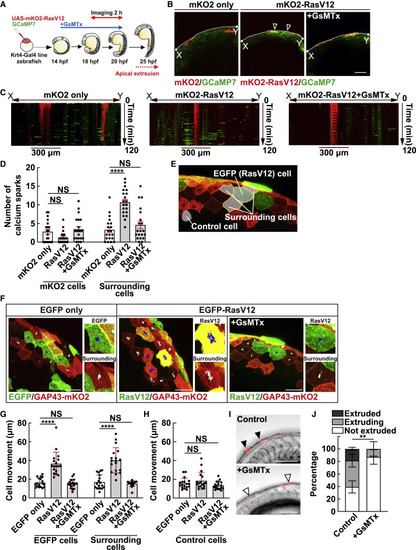
Figure 6. Mechanosensitive calcium channel positively regulates calcium sparks, cell movement, and apical extrusion in zebrafish larvae (A) Schematic illustration of the experimental time course to observe calcium sparks before apical extrusion in zebrafish. (B–D) Mechanosensitive calcium channel-mediated calcium sparks around RasV12-expressing cells in zebrafish larvae. (B) Fluorescence images of zebrafish 18-somite larvae expressing mKO2-RasV12 and GCaMP7 in the absence or presence of GsMTx. The result shown is the representative from 10 independent experiments. The arrowheads indicate calcium spark-positive cells. (C) Kymographs showing the calcium sparks (green) around RasV12-expressing cells (red). The area used for analysis (X-Y in B) is shown on the horizontal axis, and the time is shown on the vertical axis. (D) Quantification of the frequency of calcium sparks within 300 μm around RasV12-expressing cells or mKO2 only-expressing cells for 2 h in the absence or presence of GsMTx. Individual data points are plotted with the means ± SEMs. ∗∗∗∗p < 0.0001 and NS, not significant (1-way ANOVA with Tukey’s post-hoc multiple comparison test); n = 20 cells for each experimental condition. (E–H) Effect of GsMTx on the cell movement in zebrafish larvae. (E) The cells used for the analysis of cell movement. A fluorescence image of zebrafish 18-somite larvae expressing EGFP-RasV12 and GAP43-mKO2. The white dotted line indicates an EGFP-RasV12 cell, while the yellow dotted line indicates surrounding normal cells expressing GAP43-mKO2. The blue dotted line indicates a cell distant from RasV12-expressing cells, which was used as control. (F) Fluorescence images of zebrafish 18-somite larvae expressing EGFP or EGFP-RasV12 and GAP43-mKO2 in the absence or presence of GsMTx. The trajectory of a cellular centroid shows the sum of the frame-to-frame distances for 2 h (12 frames at 10-min interval). The result shown is the representative from 10 independent experiments. (G) Quantification of the total distance of cell movement for 2 h. The RasV12-expressing cells and surrounding cells (as shown in E and F) were analyzed. Individual data points are plotted with the means ± SDs. ∗∗∗∗p < 0.0001 and NS, not significant (2-way ANOVA with Tukey’s post-hoc multiple comparison test); n = 18 cells for each experimental condition. (H) Quantification of the total distance of cell movement of the control cells for 2 h. The control cells distant from RasV12-expressing cells (as shown in E) were analyzed. Individual data points are plotted with the means ± SDs. NS, not significant (2-way ANOVA with Tukey’s post-hoc multiple comparison test); n = 18 cells for each experimental condition. (I and J) Effect of the mechanosensitive calcium channel inhibitor GsMTx on apical extrusion of RasV12-transformed cells. (I) Fluorescence images of zebrafish larvae (24 hpf) expressing mKO2-RasV12 treated with or without GsMTx for 4 h. Black and white arrowheads indicate apically extruded and not-extruded mKO2-RasV12 cells, respectively. (J) Quantification of apical extrusion of RasV12-expressing cells at 24 hpf. Data are means ± SDs from 5 independent experiments. ∗∗p < 0.01 (2-tailed Student’s t tests). (B, F, and I) Scale bars, 100 μm. See also Video S4. |