
Fig. 5
- ID
- ZDB-FIG-220714-6
- Publication
- Kuromiya et al., 2022 - Calcium sparks enhance the tissue fluidity within epithelial layers and promote apical extrusion of transformed cells
- Other Figures
- All Figure Page
- Back to All Figure Page
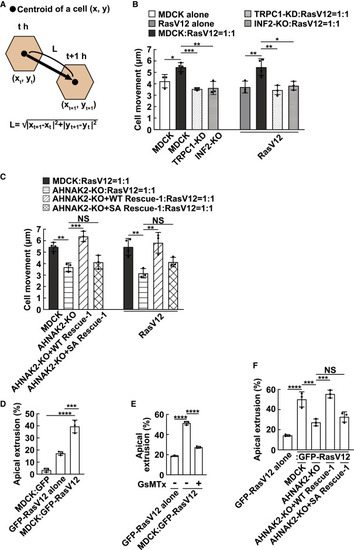
Figure 5. Calcium sparks promote the epithelial tissue fluidity at the early phase of cell competition through the INF2-AHNAK2 pathway (A) The schematic diagram for the displacement of the centroid of a cell. Black dots indicate the centroid of a cell (x, y). Using time-lapse imaging, cell movement was analyzed by calculating the displacement from the centroid of the cells at t h (xt, yt) to that at t + 1 h (xt + 1, yt + 1): the length of the black arrow (“L”). (B) Effect of TRPC1-knockdown or INF2-KO on cell movement. The total cell movement at 6–10 h after RasV12 induction was analyzed. Data are means ± SDs from 4 (MDCK:RasV12 = 1:1) or 3 (the other conditions) independent experiments. ∗p < 0.05, ∗∗p < 0.01, and ∗∗∗p < 0.001 (1-way ANOVA with Dunnett’s test); n = 30 cells for each experiment. (C) Effect of the rescue of the expression of AHNAK2-WT (wild-type) or -SA (non-phosphorylatable form) into AHNAK2-KO cells on cell movement. Data are means ± SDs from 4 (MDCK:RasV12 = 1:1) or 3 (the other conditions) independent experiments. ∗∗p < 0.01, ∗∗∗p < 0.001, and NS, not significant (1-way ANOVA with Dunnett’s test); n = 30 cells for each experiment. (D) Quantification of apical extrusion of RasV12-transformed cells mix cultured with normal cells. At 24 h after GFP or GFP-RasV12 induction, the ratio of apical extrusion was analyzed. Data are means ± SDs from 3 independent experiments. ∗∗∗p < 0.001 and ∗∗∗∗p < 0.0001 (1-way ANOVA with Dunnett’s test); n > 250 cells for each experiment. (E) Effect of the mechanosensitive calcium channel inhibitor GsMTx on apical extrusion of RasV12-transformed cells. Cells were cultured in the presence of GsMTx for 16 h after RasV12 induction, followed by the washout of GsMTx. At 24 h after RasV12 induction, the ratio of apical extrusion was analyzed. Data are means ± SDs from 3 independent experiments. ∗∗∗∗p < 0.0001 (1-way ANOVA with Dunnett’s test); n > 250 cells for each experiment. (F) Effect of the rescue of AHNAK2-WT or -SA expression into AHNAK2-KO cells on apical extrusion. At 24 h after RasV12 induction, the ratio of apical extrusion was analyzed. Data are means ± SDs from 3 independent experiments. ∗∗∗p < 0.001, ∗∗∗∗p < 0.0001, and NS, not significant (1-way ANOVA with Tukey’s test); n > 250 cells for each experiment. See also Figure S5. |