
Fig. 3
- ID
- ZDB-FIG-220714-4
- Publication
- Kuromiya et al., 2022 - Calcium sparks enhance the tissue fluidity within epithelial layers and promote apical extrusion of transformed cells
- Other Figures
- All Figure Page
- Back to All Figure Page
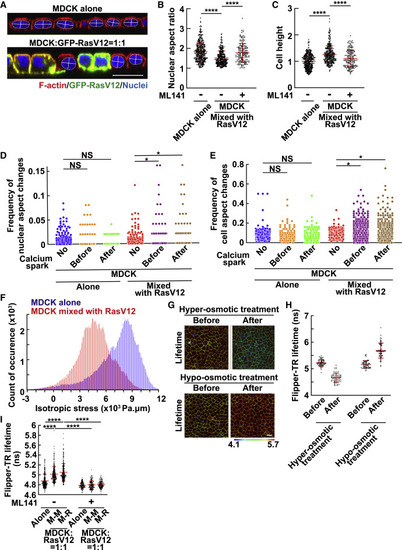
Figure 3. Mix culture with RasV12-transformed cells induces morphological and mechanical changes in normal cells in a non-cell-autonomous manner (A–C) The nuclear aspect ratio or cell height in normal cells mix cultured with RasV12-transformed cells. (A) The xz-immunofluorescence images of normal cells mix cultured with RasV12 cells. Normal MDCK cells were cultured alone or mix cultured with MDCK-pTR GFP-RasV12 cells at a ratio of 1:1, followed by staining with Alexa Fluor-568-phalloidin (red) and Hoechst (blue). The lines indicate the major and minor axes of the nucleus. (B and C) The nuclear aspect ratio (major axis/minor axis) (B) or cell height (C) in the absence or presence of ML141 was quantified from xz-confocal images. For cell height, values are expressed as a ratio relative to the average of MDCK alone. Cumulative data from 5 (absence of ML141) or 3 (presence of ML141) independent experiments are shown as means ± SDs. ∗∗∗∗p < 0.0001 (1-way ANOVA with Dunnett’s test); n = 355, 306, and 162 cells. (D and E) Frequency of changes in the nuclear aspect ratio (D) or cell aspect ratio (E). MDCK-GCaMP6s cells were mix cultured with normal MDCK (MDCK alone) or MDCK-pTRE3G Myc-RasV12 cells (MDCK mixed with RasV12). Cells were stained with Hoechst and the far-red silicon rhodamine (SiR)-actin fluorescent probe, followed by time-lapse imaging with 30-s intervals during 6–10 h after the induction of RasV12 expression. The dynamic changes in the nuclear or cell aspect ratio before and after calcium sparks were analyzed. The triangle threshold algorithm was applied to obtain the threshold for morphological change points (for details, see STAR Methods). The values are expressed as a frequency of significant changes within each 30-s interval. Cumulative data from 2 independent experiments are shown. ∗p < 0.05 and NS, not significant (Wilcoxon signed sum test with Bonferroni correction). n = 414, 117, 117, 301, 283, and 283 cells. (F) Isotropic stress in normal cells mix cultured with RasV12-transformed cells. MDCK-GCaMP6s cells were mix cultured with MDCK cells or MDCK-pTRE3G Myc-RasV12 at a ratio of 1:1 on a soft silicone elastomer substrate coated with fluorescent beads, which allowed us to measure the traction forces exerted by the cells on the underlying substrate using traction force microscopy (TFM). The traction forces were converted to intracellular stress inside the monolayer using Bayesian inversion stress microscopy (BISM). The isotropic stress in the monolayers at 6–10 h after the induction of RasV12 expression was calculated. The representative histograms are shown from 2 independent experiments. Binning of the histogram is presented every 100 Pa.μm, and the y axis indicates the count of occurrence in each bin. (G and H) Effect of hyper- or hypo-osmotic treatment on the fluorescence lifetime of Flipper-TR. Normal MDCK cells were stained with the Flipper-TR membrane tension probe. The fluorescence lifetime of Flipper-TR was measured using fluorescence lifetime imaging microscopy (FLIM) before and after hyper-osmotic treatment for 20 min or hypo-osmotic treatment for 10 min. (G) Representative FLIM images of MDCK cells before and after hyper- or hypo-osmotic treatment. The color bar corresponds to lifetime (nanoseconds). (H) Quantification of Flipper-TR lifetime at cell-cell adhesions. Data are means ± SDs from 60 regions for each experiment. (I) Effect of mix culture with RasV12-transformed cells on Flipper-TR lifetime. Flipper-TR lifetime at cell-cell adhesions between MDCK cells (M-M) or between MDCK and RasV12 cells (M-R) was analyzed. Cumulative data from 4 (absence of ML141) or 2 (presence of ML141) independent experiments are shown as means ± SDs. ∗∗∗∗p < 0.0001 (1-way ANOVA with Tukey’s test); n = 60 regions for each experiment. (A and G) Scale bar, 20 μm. See also Figure S4. |