FIGURE

FIGURE 4

ID
ZDB-FIG-220709-9
Publication
Maung Ye et al., 2022 - High-Throughput Imaging of Blood Flow Reveals Developmental Changes in Distribution Patterns of Hemodynamic Quantities in Developing Zebrafish
Other Figures
All Figure Page
Back to All Figure Page
FIGURE 4

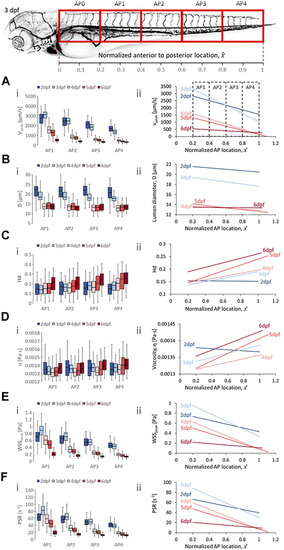
Developmental trends of morphological and hemodynamic quantities in the dorsal aorta/caudal artery (DA/CA). (A) The changes in Vpeak at four regions along the anterior-to-posterior (AP) axis (i) and the AP trend for Vpeak(ii). (B) The changes in D at four AP regions (i) and the AP trend for D(ii). (C) The changes in Hd at four AP regions (i) and the AP trend for Hd(ii). (D) The changes in η at four AP regions (i) and the AP trend for η(ii). (E) The changes in WSSpeak at four AP regions (i) and the AP trend for WSSpeak(ii). (F) The changes in PSR at four AP regions (i) and the AP trend for PSR(ii). Box plots in (i) of Panels (A–D) show the median and the first (Q1) and third (Q3) quartile levels of the hemodynamic quantity for the pooled zebrafish data. The whisker bars represent the maximum and minimum ranges of the data that lie within 1.5 times of the interquartile range (IQR = Q3 − Q1) beyond Q1 and Q3.

Expression Data

Expression Detail
Antibody Labeling
Phenotype Data

Phenotype Detail
Acknowledgments
This image is the copyrighted work of the attributed author or publisher, and ZFIN has permission only to display this image to its users. Additional permissions should be obtained from the applicable author or publisher of the image. Full text @ Front. Physiol.