FIGURE

FIGURE 1

ID
ZDB-FIG-220709-6
Publication
Maung Ye et al., 2022 - High-Throughput Imaging of Blood Flow Reveals Developmental Changes in Distribution Patterns of Hemodynamic Quantities in Developing Zebrafish
Other Figures
All Figure Page
Back to All Figure Page
FIGURE 1

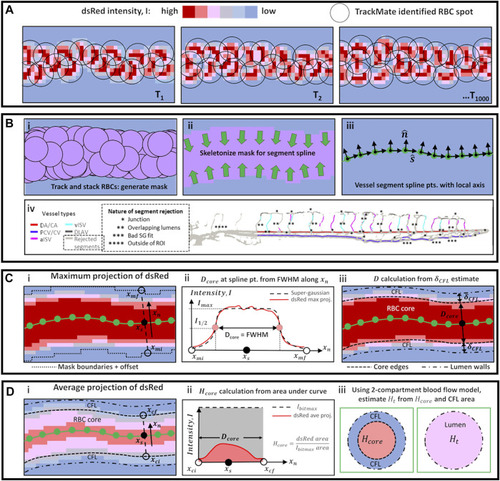
Schematic diagrams of methods used for automated vessel labeling, data filtering, and vessel diameter and hematocrit calculation. (A) High speed image sequence of dsRed intensity was the only collected data from experiments. (B) Series of steps using TrackMate data (i–iii) to obtain vessel spline segment points and directions s^ and n^, and (iv) perform script-automated vessel-type labeling and data filtering from the spline segment skeletons in iii (see text for explanation). (C) Sequence of steps to calculate the width of the RBC core (Dcore) at a spline location (i) by evaluating the full-width-half-maximum (FWHM) range of the Super-gaussian fit to the maximum projection signal (ii). The lumen diameter D is obtained by iterative evaluation (see text) of the cell-free plasma layer (CFL) thickness (δCFL). (D) Sequence of steps to calculate the core hematocrit (Hcore) at a spline location (i) by taking the area fraction between ceiling intensity (Ibitmax) and the average projection signal within the RBC core width (ii). The tube hematocrit in the lumen (Ht) is evaluated by considering the effective contribution of RBC-rich core and plasma-rich CFL.

Expression Data

Expression Detail
Antibody Labeling
Phenotype Data

Phenotype Detail
Acknowledgments
This image is the copyrighted work of the attributed author or publisher, and ZFIN has permission only to display this image to its users. Additional permissions should be obtained from the applicable author or publisher of the image. Full text @ Front. Physiol.