
FIGURE
FIGURE 3
- ID
- ZDB-FIG-220709-8
- Publication
- Maung Ye et al., 2022 - High-Throughput Imaging of Blood Flow Reveals Developmental Changes in Distribution Patterns of Hemodynamic Quantities in Developing Zebrafish
- Other Figures
- All Figure Page
- Back to All Figure Page
FIGURE 3
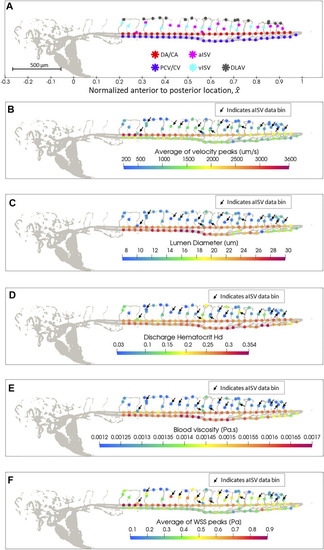
Spatial distribution map of data in zebrafish 28 of the 2 dpf data set after automated spatial bin averaging: |
Expression Data
Expression Detail
Antibody Labeling
Phenotype Data
Phenotype Detail
Acknowledgments
This image is the copyrighted work of the attributed author or publisher, and
ZFIN has permission only to display this image to its users.
Additional permissions should be obtained from the applicable author or publisher of the image.
Full text @ Front. Physiol.