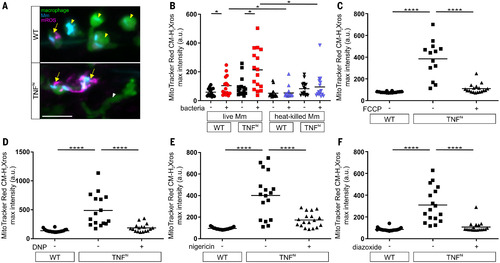
Fig. 1. ETC-derived mROS drive necrosis of Mm-infected macrophages in TNF-high conditions. (A) Representative pseudocolored confocal images of wild-type or TNFhi larvae with yellow fluorescent protein (YFP)–expressing macrophages (green), 1 day after infection with EBFP2-expresssing Mm (blue), showing MitoTracker Red CM-H2Xros (magenta) fluorescence. White arrowheads, uninfected macrophages; yellow arrowheads, infected macrophages; yellow arrows, infected macrophages positive for mROS. Scale bar, 20 μm. (B) Quantification of mROS in wild-type or TNFhi larvae 9 hours after injection of live or heat-killed Mm. Each point represents the mean maximum intensity fluorescence of MitoTracker Red CM-H2Xros per fish. Black symbols represent macrophages that do not contain bacteria. Red and purple symbols represent Mm-infected and heat-killed Mm-containing macrophages, respectively, in the same animal. Horizontal bars denote means; *P < 0.05 (one-way ANOVA with uncorrected Dunn’s post-test for differences between macrophages in the same animal and with Tukey’s post-test for differences between treatments). Data are representative of two independent experiments. (C to F) Quantification of mROS in larvae 1 day after infection with Mm that are wild-type or TNFhi treated with FCCP (C), DNP (D), nigericin (E), or diazoxide (F), or vehicle. Horizontal bars denote means; ****P < 0.0001 (one-way ANOVA with Tukey’s post-test). Data are representative of two or three independent experiments.
|
