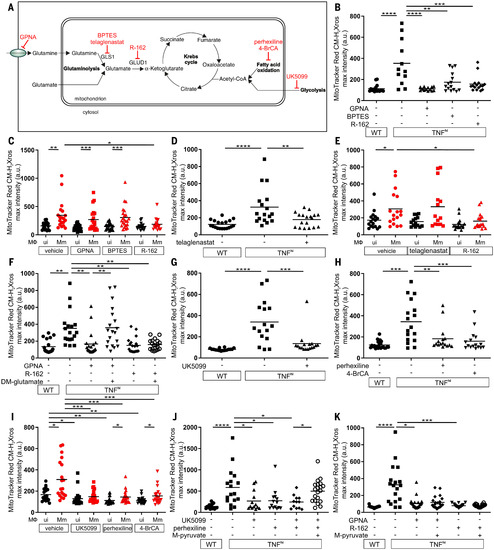
Fig. 4. TNF-induced glutamine cellular uptake and increased glutaminolysis is responsible for RET and mROS production in mycobacterium-infected macrophages. (A) Illustration of main metabolic pathways fueling the Krebs cycle with inhibitors used (truncated red arrows). GLUD1, glutamate dehydrogenase 1. (B to K) Quantification of mROS in larvae 1 day after infection with Mm that are wild-type or TNFhi treated with GPNA, BPTES, R-162, or vehicle (B); wild-type treated with GPNA, BPTES, R-162, or vehicle (C); wild-type or TNFhi treated with telaglenastat or vehicle (D); wild-type treated with telaglenastat, R-162, or vehicle (E); wild-type or TNFhi treated with vehicle, or GPNA or R-162 alone or in combination with DM-glutamate (F); wild-type or TNFhi treated with UK5099 or vehicle (G); wild-type or TNFhi treated with perhexiline, 4-BrCA, or vehicle (H); wild-type treated with UK5099, perhexiline, 4-BrCA, or vehicle (I); wild-type or TNFhi treated with vehicle, or UK5099 or perhexiline alone or in combination with M-pyruvate (J); or GPNA or R-162 alone or in combination with M-pyruvate (K). Horizontal bars denote means; *P < 0.05, **P < 0.01, ***P < 0.001, ****P < 0.0001 [one-way ANOVA with Tukey’s post-test in (B), (D), (F) to (H), (J), and (K); Dunn’s post-test in (C), (E), and (I)]. Black and red symbols in (C), (E), and (I) represent uninfected (ui) and Mm-infected (Mm) macrophages, respectively, in the same animals. Data are representative of two or three independent experiments [(B) to (D), (G) to (I)] or a single experiment [(E), (F), (J), and (K)].
|