
Fig. 2
- ID
- ZDB-FIG-220622-96
- Publication
- Yang et al., 2022 - Myoneurin regulates BMP signaling by competing with Ppm1a for Smad binding
- Other Figures
- All Figure Page
- Back to All Figure Page
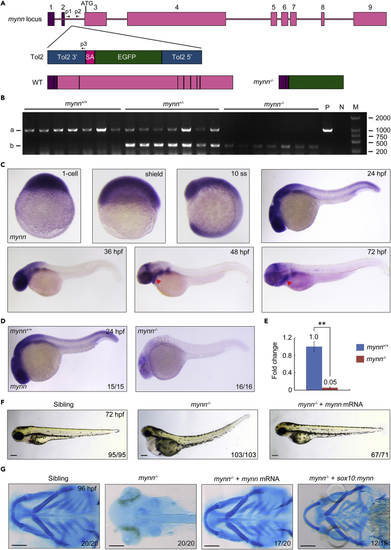
mynn was trapped in the T054 line (A) Genomic structure of the mynn locus and putative transcripts. Exons are numbered. The binding positions and directions of the primers used in (B) are indicated. Note that in the homozygous embryos, the transcripts of mynn only contain the first two exons at the upstream of the translational initiation site. (B) Genotyping of individual embryos by PCR. Embryos collected from mynn heterozygote intercrosses were separated based on GFP intensity. Three primers, p1, p2, and p3, were used together for PCR. The upper (a) and lower (b) bands represented the wild-type and recombinant allele, respectively. M, molecular marker; P, positive control; N, negative control with no template. (C) Expression pattern of mynn in wild-type embryos at indicated stages detected by in situ hybridization. The transcripts are overt in the pharyngeal region at 48 and 72 hpf as indicated by red arrowheads. (D) Expression pattern of mynn in embryos from different genotypes. Note that the mynn expression in mynn−/− embryos was almost disappeared. (E) RT-PCR analysis of mynn transcripts in wild-type and mutant embryos at 24 hpf. β-actin was used as an internal control. The data were presented as mean ± SD from three independent biological repeats. Total RNA of each group was extracted from a pool of 30 embryos. ∗∗, p < 0.01 (by Student’s t test). (F) Overexpression of mynn rescued the mutant phenotype. mynn heterozygote intercrosses were injected with 200 pg mynn mRNA at the one-cell stage. The homozygous mutants were sorted out at 24 hpf by their EGFP intensity, and their morphology was observed at 72 hpf. The ratio of embryos with presented morphology was indicated. Scale bars, 200 μm. (G) Head skeletons stained with Alcian blue. Note that cartilages of mynn−/− mutants were missed and the missing cartilages could be rescued by injection of 200 pg mynn mRNA into mynn−/− embryos at the one-cell stage or specific overexpression of mynn in sox10+ NCCs. Scale bars, 200 μm. |
| Gene: | |
|---|---|
| Fish: | |
| Anatomical Terms: | |
| Stage Range: | 1-cell to Protruding-mouth |
| Fish: | |
|---|---|
| Observed In: | |
| Stage Range: | Prim-5 to Day 4 |