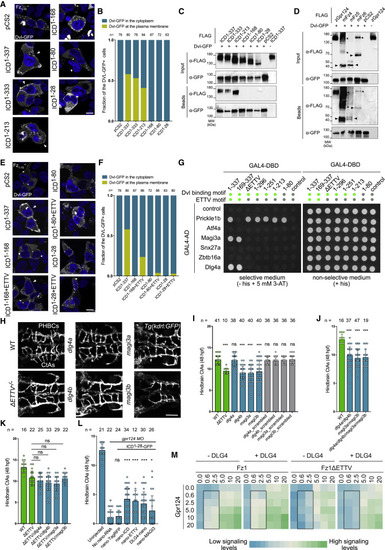
Figure 4. Dlg4 and Magi3 interact with the ETTV motif of Gpr124 during brain angiogenesis (A and E) Distribution of Dvl-GFP co-expressed with zebrafish Gpr124 or its variants in FZ1–10−/− HEK293T cells. Arrowheads point to Dvl-GFP signal at the plasma membrane. (B and F) Quantification of the fraction of FZ1–10−/− HEK293T cells showing membrane localization of Dvl-GFP when co-expressed with zebrafish Gpr124 or its variants. (C) GFP-Trap co-immunoprecipitation assays in total lysates of HEK293T cells co-expressing Dvl-GFP and N-terminally FLAG-tagged Gpr124 or its ICD variants. (D) GFP-Trap co-immunoprecipitation between Dvl-GFP and Gpr124 or different Fz receptors. Arrowheads and asterisks label Fz monomers and likely multimers, respectively. (G) Agar plate growth of spotted yeast cultures co-transformed with different combinations of GAL4-DBD and GAL4-AD fusion constructs onto selective or non-selective conditions. Green and gray dots illustrate, respectively, the presence or absence of the Dvl binding or ETTV motif in the GAL4-DBD fusions. (H and I) Dorsal views (H) and quantification (I) of 48 hpf hindbrain CtAs of WT embryos injected at the one-cell stage with 150 pg of zCas9 mRNA and 30 pg of the illustrated sgRNAs. (J) Same as (I) after injection with a combination of different sgRNAs, each 30 pg. (K) Same as (I) in ΔETTV−/− mutant embryos. (L) Quantification of 48 hpf hindbrain CtAs of gpr124 morphant embryos injected at the one-cell stage with 100 pg of Gpr124-ΔICD-GFP mRNA together with the indicated nanobody fusion mRNAs. (M) Heatmap representation of average luciferase activities 48 h after transfection of the indicated constructs in FZ1–10−/− HEK293T cells. Boxed area highlights the conditions most affected by ETTV and Dlg4; n = 3. Scale bars, 10 μm for cultured cells and 100 μm for zebrafish images. Related to Figure S2.
|
