
- Title
-
An integrated model for Gpr124 function in Wnt7a/b signaling among vertebrates
- Authors
- America, M., Bostaille, N., Eubelen, M., Martin, M., Stainier, D.Y.R., Vanhollebeke, B.
- Source
- Full text @ Cell Rep.
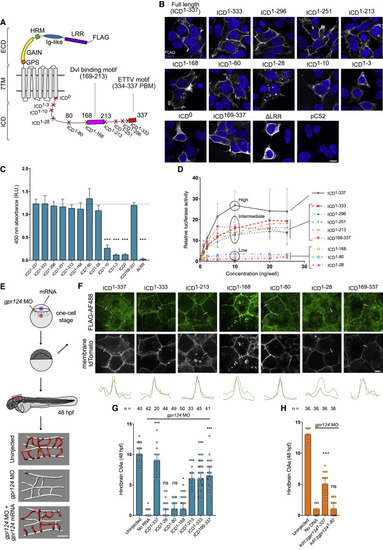
Figure 1. The intracellular domain of zebrafish Gpr124 contains two important motifs (A) Schematic representation of zebrafish Gpr124 and its variants. Protein domains from N to C terminus are as follows: the extracellular domain (ECD), leucine-rich repeats (LRR), immunoglobulin-like domain (Ig-like), hormone receptor motif (HRM), GPCR autoproteolysis-inducing (GAIN) domain with GPCR proteolysis site (GPS), 7 transmembrane domain (7TM), and intracellular domain (ICD), containing a Dvl-binding motif and a C-terminal PDZ-binding motif or ETTV motif. (B and C) Anti-FLAG immunostaining (B) and cell-surface ELISA (C) of transiently expressed FLAG-tagged zebrafish Gpr124 or its ICD truncation variants in HEK293T cells; n = 3. (D) Luciferase activities of HEK293 STF cells co-transfected with Wnt7a, Fz1, Reck, and increasing amounts of Gpr124 or its ICD truncation variants. Data are normalized to ELISA data; n = 3. (E) Setup for mRNA-injection-based brain angiogenesis assays in zebrafish embryos and representative 3D rendering of the cerebrovasculatures. (F) Anti-FLAG immunostaining of zebrafish blastulas injected with mRNA encoding FLAG-tagged zebrafish Gpr124 together with membrane-localized tdTomato; n = 3. (G and H) Hindbrain CtAs of gpr124 morphant embryos at 48 hpf injected at the one-cell stage with 100 pg of the indicated mRNAs (G) or with 7 pg of the indicated DNA construct and 25 pg Tol2 transposase mRNA (H). Scale bars, 10 μm. Related to Figure S1. In this and all other figures, ns, not significant; ∗p < 0.05; ∗∗p < 0.01; and ∗∗∗p < 0.001, dual luciferase assay data and ELISA data are represented as mean ± SD, and in vivo data are represented as median ± 95 confidence interval (CI). |
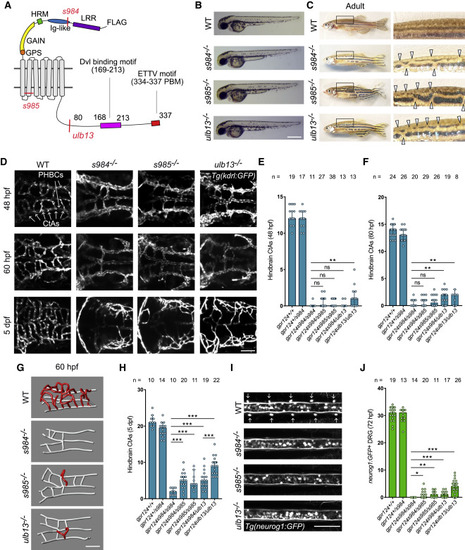
Figure 2. Germline mutants of the zebrafish Gpr124 ICD exhibit brain vascular defects (A) Scheme of zebrafish Gpr124 highlighting the TALEN or CRISPR-Cas9 target sites corresponding to the gpr124s984, gpr124s985, and gpr124ulb13 alleles. (B) Lateral views of WT, gpr124s984/s984 (s984−/−), gpr124s985/s985 (s985−/−), and gpr124ulb13/ulb13 (ulb13−/−) embryos at 60 hpf. (C) Lateral views of the adult WT and gpr124 mutant skin pigmentation patterns. Arrowheads point at stripe discontinuities. (D) Dorsal views of hindbrain vasculatures (E) Quantification of hindbrain CtAs of WT and gpr124 mutant embryos at 48 hpf. (F) Same as (E) at 60 hpf. (G) 3D representation of the cerebrovasculature of 60 hpf WT and gpr124 mutant embryos. Red vessels are Wnt7a/Gpr124/Reck-dependent CtAs that sprout from white perineural vessels. (H) Same as (E) in 5 dpf larvae. (I and J) Dorsal views (I) and quantification (J) of dorsal root ganglia in the trunk region of WT and gpr124 mutant larvae at 72 hpf. Scale bars, 0.5 mm for (B) and 100 μm for (D), (G), and (I). Related to Figure S1.
|

Figure 3. The Dvl and ETTV motifs act in a partially redundant manner during zebrafish brain angiogenesis (A) Scheme of zebrafish Gpr124 highlighting the CRISPR-Cas9 target site corresponding to the gpr124ulb14(ΔETTV) mutant allele. (B) Lateral views of WT and ΔETTV−/− mutant embryos at 60 hpf. (C) Lateral views of the skin-pigmentation patterns of WT and ΔETTV−/− mutant adults. (D) Dorsal views of hindbrain vasculature of WT and ΔETTV−/− mutants. (E) Quantification of CtAs of WT and ΔETTV−/− mutant embryos at 48 hpf. (F) Same as (E) at 60 hpf. (G) 3D representation of cerebrovasculature of 60 hpf WT and ΔETTV mutant embryos. (H) Same as (E) in 5 dpf larvae. (I) Quantification of the number of lumenized CtAs in 48 hpf WT and ΔETTV mutant embryos. (J and K) Dorsal views (J) and quantification (K) of dorsal root ganglia in the trunk region of WT and ΔETTV mutant larvae at 72 hpf. (L) Luciferase activities of HEK293 STF cells co-transfected with Wnt7a, Fz1, Reck, and increasing amounts of the indicated Gpr124 ICD variants; n = 3. (M) Quantification of hindbrain CtAs of gpr124 morphant embryos at 48 hpf injected at the one-cell stage with 100 pg of the indicated mRNAs. Scale bars, 0.5 mm for (B) and 100 μm for (D), (G), and (J). Related to Figure S1. |
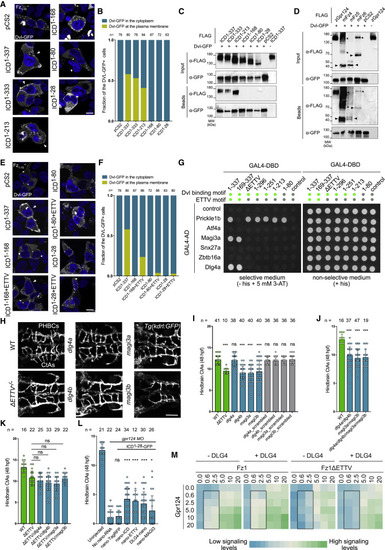
Figure 4. Dlg4 and Magi3 interact with the ETTV motif of Gpr124 during brain angiogenesis (A and E) Distribution of Dvl-GFP co-expressed with zebrafish Gpr124 or its variants in FZ1–10−/− HEK293T cells. Arrowheads point to Dvl-GFP signal at the plasma membrane. (B and F) Quantification of the fraction of FZ1–10−/− HEK293T cells showing membrane localization of Dvl-GFP when co-expressed with zebrafish Gpr124 or its variants. (C) GFP-Trap co-immunoprecipitation assays in total lysates of HEK293T cells co-expressing Dvl-GFP and N-terminally FLAG-tagged Gpr124 or its ICD variants. (D) GFP-Trap co-immunoprecipitation between Dvl-GFP and Gpr124 or different Fz receptors. Arrowheads and asterisks label Fz monomers and likely multimers, respectively. (G) Agar plate growth of spotted yeast cultures co-transformed with different combinations of GAL4-DBD and GAL4-AD fusion constructs onto selective or non-selective conditions. Green and gray dots illustrate, respectively, the presence or absence of the Dvl binding or ETTV motif in the GAL4-DBD fusions. (H and I) Dorsal views (H) and quantification (I) of 48 hpf hindbrain CtAs of WT embryos injected at the one-cell stage with 150 pg of zCas9 mRNA and 30 pg of the illustrated sgRNAs. (J) Same as (I) after injection with a combination of different sgRNAs, each 30 pg. (K) Same as (I) in ΔETTV−/− mutant embryos. (L) Quantification of 48 hpf hindbrain CtAs of gpr124 morphant embryos injected at the one-cell stage with 100 pg of Gpr124-ΔICD-GFP mRNA together with the indicated nanobody fusion mRNAs. (M) Heatmap representation of average luciferase activities 48 h after transfection of the indicated constructs in FZ1–10−/− HEK293T cells. Boxed area highlights the conditions most affected by ETTV and Dlg4; n = 3. Scale bars, 10 μm for cultured cells and 100 μm for zebrafish images. Related to Figure S2. |

Figure 5. ICD-deleted mouse and human GPR124 are competent for brain angiogenesis (A) Sequence alignment of zebrafish, mouse, and human Gpr124 intracellular domains. Dvl-binding and ETTV motifs are boxed, and truncations sites are indicated by red arrowheads. (B and C) Luciferase activities of HEK293 STF cells co-transfected with Wnt7a, Fz1, Reck, and increasing amounts of mouse (B) or human (C) GPR124 or their ICD truncation variants. Data are normalized to ELISA data; n = 3. (D) Agar plate growth of spotted yeast cultures co-transformed with different combinations of GAL4-DBD and GAL4-AD fusion constructs onto selective or non-selective conditions. Green and gray dots illustrate, respectively, the presence or absence of the ETTV motif in the GAL4-DBD fusions. (E and F) Quantification of hindbrain CtAs in 48 hpf gpr124 morphant embryos injected at the one-cell stage with 100 pg of the indicated mRNAs of mouse (E) and human (F) Gpr124 and their ICD variants. (G) Quantification of hindbrain CtAs of gpr124 morphant embryos at 48 hpf injected at the one-cell stage with 7 pg of the indicated DNA constructs and 25 pg Tol2 transposase mRNA. Zebrafish data are duplicated from Figure 1H. (H) Luciferase values of HEK293 STF cells co-transfected with Wnt7a, Fz1, and Reck, with or without zebrafish Gpr124 or mouse Gpr124, and supplemented or not with 10 mM of the indicated recombinant protein, n = 3. Related to Figures S3 and S4. |

Figure 6. A Dvl-independent interaction mechanism between mammalian GPR124 receptors and Frizzled (A) Distribution of Dvl-GFP co-expressed with full-length (FL) zebrafish (z), mouse (m), or human (h) Gpr124 or their ΔICD (ICD1–80 and corresponding) variants in FZ1–10−/− HEK293T cells. The arrowhead points to Dvl-GFP signal at the plasma membrane. (B) GFP-Trap co-immunoprecipitation assays in total lysates of FZ1–10−/− HEK293T cells co-expressing Dvl-GFP and N-terminally FLAG-tagged zebrafish, mouse, or human FL Gpr124 and their ΔICD variants; n = 3. (C) Distribution of individually expressed TagRFP-fused zebrafish or mouse FL Gpr124, or their ΔICD variants, as well as Fz4-GFP in zebrafish blastula deep-layer cells. (D) Representative images of zebrafish blastula deep-layer cells co-expressing Fz4-GFP and zebrafish FL or ΔICD Gpr124-TagRFP, with or without Dvl; n = 3. (E) Quantification of the enrichment level of Fz4-GFP in the Gpr124-TagRFP+ membranes in the presence or absence of Dvl. (F) Same as (D) with corresponding mouse GPR124 constructs. For (C), (D), and (F), the cells annotated with an asterisk are magnified, and the pixel intensity of the green and magenta channels along a virtual clockwise path following the cell cortex from a to b is plotted. (G) Same as (E) for mouse GPR124 constructs. (H) Distribution of mouse Fz4-GFP in zebrafish blastula deep-layer cells in the presence or absence of Dvl. (I) Bimolecular complementation assay strategy. Illustration created with BioRender.com. (J) Representative images of zebrafish blastula deep-layer cells co-expressing the indicated bimolecular complementation constructs, with or without Dvl. Venus junctional signal is indicated with arrowheads; n = 3. Data are represented as mean ± SD. Scale bars, 10 μm. Related to Figure S4. |
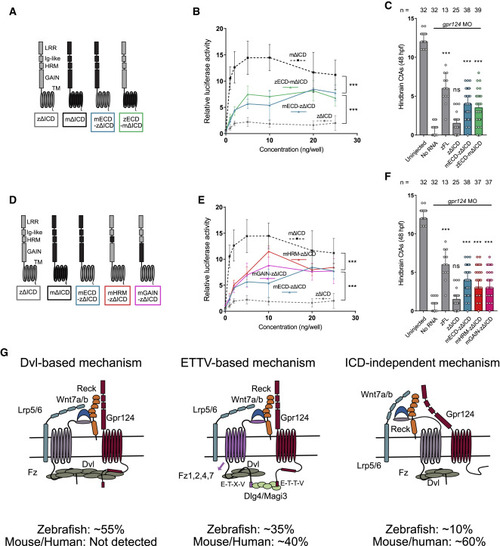
Figure 7. Functional comparison of mouse and zebrafish Gpr124 extracellular and transmembrane domains (A and D) Schematics of the investigated mouse and zebrafish Gpr124 chimeras. (B and E) Luciferase dose-response assays in HEK293 STF cells co-transfected with Wnt7a, Fz1, Reck, and the indicated Gpr124 chimeras. Data are normalized to ELISA data, n = 3. (C and F) Quantification of hindbrain CtAs in 48 hpf gpr124 morphant embryos injected at the one-cell stage with 100 pg of the indicated mRNAs. (G) Model for the various modalities of Gpr124/Reck-dependent Wnt7a/b signaling and the importance of their relative contribution in different species. Related to Figures S5 and S6. |