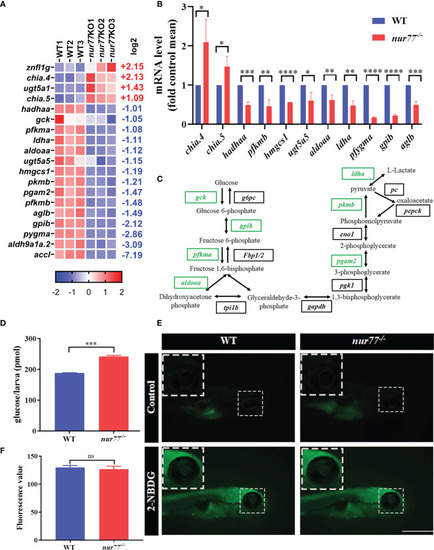
Nur77 regulates carbohydrate metabolism in zebrafish larvae. (A) Heatmaps of transcripts in carbohydrate metabolism enrichment. Colors represent high (red), low (blue), or average (white) expression values based on Z-score-normalized fragments per kilobase per million mapped read (FPKM) values for each gene. The Z-score indicators are shown under each map. The fold change (log2) is shown on the right. (B) The validation of the expression levels of differentially expressed genes by qRT-PCR analysis in the categories of carbohydrate metabolism (n = 3). (C) Disturbed glycolysis/gluconeogenesis. Blocks represent transcript-encoded enzymes. Green blocks represent downregulated genes, and black blocks represent unchanged genes. (D) The total free glucose contents of WT and nur77−/− zebrafish (n = 3). (E) 2-NBDG glucose uptake of wildtype and nur77−/− mutant larvae; the glucose uptake level is indicated by the fluorescence of lens (arrow) imaged by fluorescent microscopy. Wildtype and nur77−/− without 2-NBDG were used for control groups (upper panel). (F) Eye fluorescence intensity was measured based on images. Quantification of fluorescence intensity for WT and nur77−/− zebrafish larvae. Results were represented as means with standard errors (n = 3); ns, no significance; *p < 0.05, **p < 0.01, ***p < 0.001, ****p < 0.0001 by t-test.
|
