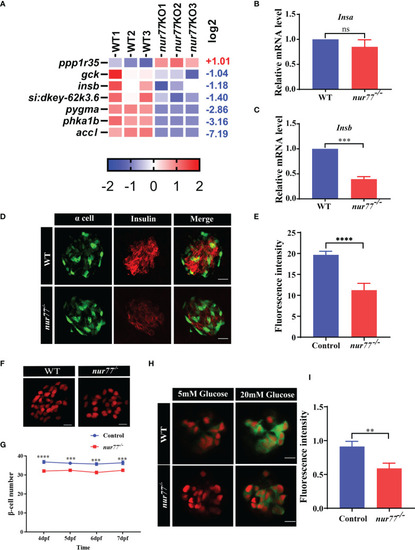
Nur77 regulates insulin secretion and β-cell number in zebrafish larvae. (A) Heatmaps of transcripts in insulin signaling pathway. Colors represent high (red), low (blue), or average (white) expression values based on Z-score-normalized fragments per kilobase per million mapped read (FPKM) values for each gene. (B, C) The validation of the expression levels of insulin genes by qRT-PCR analysis in WT and nur77−/− zebrafish larvae, (B)insa (n = 3), (C) and insb (n = 3). (D, E) The insulin contents in WT and nur77−/− zebrafish larvae. (D) Representative images of the fluorescence of α cell and β cell from control and nur77−/−; α cells are indicated by the green fluorescence with Tg(gcg:eGFP), β cell are indicated with red fluorescence by immunostaining with insulin antibody. (E) Quantification of β-cell fluorescence intensity from control and nur77−/−. The number of larvae (n = 12~18). (F, G) The number of pancreatic β cells in Tg(Ins:H2BmCherry) and nur77−/−;Tg(Ins:H2BmCherry) zebrafish larvae. (F) Representative images of the β-cell (red) number in Tg(Ins:H2BmCherry) and nur77−/−;Tg(Ins:H2BmCherry) at 6 dpf. (G) Quantification of β-cell number in Tg(Ins:H2BmCherry) and nur77−/−;Tg(Ins:H2BmCherry) from 4 to 7 dpf zebrafish larvae (n = 19~50). (H, I) The glucose-stimulated GCaMP6s response in β cells of Tg(Ins:H2BmCherry);Tg(Ins:GCaMP6s) and nur77−/−;Tg(Ins:H2BmCherry);Tg(Ins:GCaMP6s). (H) Representative images of GCaMP6s response in β cells of Tg(Ins:H2BmCherry);Tg(Ins:GCaMP6s) and nur77−/−;Tg(Ins:H2BmCherry);Tg(Ins:GCaMP6s) by 5 or 20 mM glucose ECS solution; green signal is GCaMP6. (I) Quantification of GCaMP6s response (GFP fluorescence intensity) in β cells of Tg(Ins:H2BmCherry);Tg(Ins:GCaMP6s) and nur77−/− nur77−/−;Tg(Ins:H2BmCherry);Tg(Ins:GCaMP6s). Results are represented as means with standard errors (n = 13~20); ns, no significance; **p < 0.01, ***p < 0.001, ****p < 0.0001 by t-test.
|
