
FIGURE
Fig. 5
Fig. 5
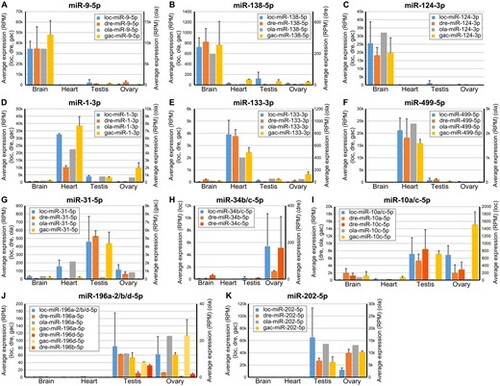
Expression patterns of selected miRNAs in spotted gar, zebrafish, medaka, and stickleback. Average expression of evolutionarily conserved, organ-enriched miRNAs. Expression levels are given in RPM (reads per million) for the four organs studied in gar, zebrafish, medaka, and stickleback. Associated SDs across biological replicates are provided for gar, zebrafish, and stickleback. |
Expression Data
Expression Detail
Antibody Labeling
Phenotype Data
Phenotype Detail
Acknowledgments
This image is the copyrighted work of the attributed author or publisher, and
ZFIN has permission only to display this image to its users.
Additional permissions should be obtained from the applicable author or publisher of the image.
Full text @ Mol Bio Evol