
Fig. 1
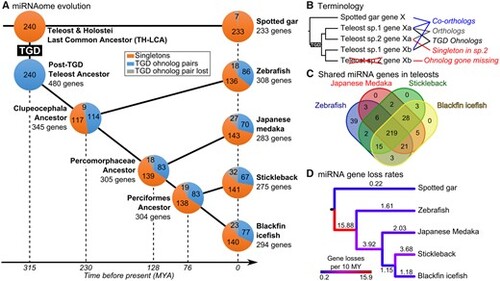
Evolution of the actinopterygian miRNA repertoire. (A) miRNA repertoire composition in spotted gar, zebrafish, medaka, stickleback, and blackfin icefish. Each pie chart represents the proportion of miRNA genes present in singleton (orange), in TGD ohnolog pairs (blue), or lost (gray). The last common ancestors of each lineage were reconstructed by maximum parsimony and divergence times were based on TimeTree (Kumar et al. 2017). The teleost genome duplication (TGD) was assumed to have happened at the estimated divergence time of Holostei and Teleosts. (B) Terminology and schematic representation of miRNA gene relationships between gar and teleosts following the TGD. (C) Overlap of miRNA gene orthologs across the four studied teleosts. (D) Color-coded miRNA gene loss rates in genes per 10 My mapped on each branch of a time-calibrated tree (Kumar et al. 2017). |