
Fig. 3
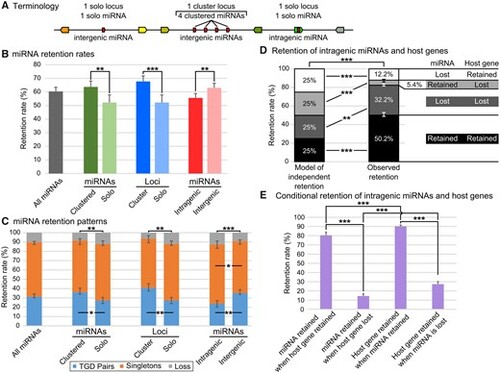
miRNA gene retention rates and patterns following the TGD varied depending on genetic context. (A) Schematic representation of terminology used for clustered miRNAs and solo miRNAs, cluster loci and solo loci, intergenic and intragenic miRNAs. (B) Retention rates of post-TGD miRNAs depending on genomic context. (C) Retention patterns of post-TGD miRNAs depending on genomic context. (D) Patterns of retention and loss of miRNAs and host genes compared with a model of independent retention. (E) Influence of the retention or the loss of a member of the miRNA/host pair on the retention of the second member of the pair. Significant differences: *P < 0.05; **P < 0.01; ***P < 0.001. |