
FIGURE
Figure 7.
- ID
- ZDB-FIG-220404-20
- Publication
- Pinion et al., 2022 - Differential electrographic signatures generated by mechanistically-diverse seizurogenic compounds in the larval zebrafish brain
- Other Figures
- All Figure Page
- Back to All Figure Page
Figure 7.
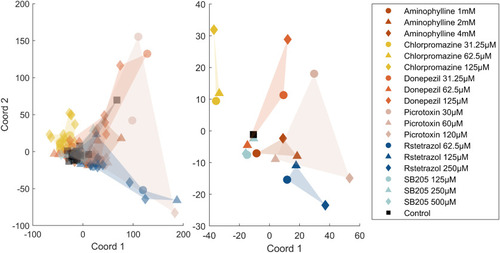
Multi-dimensional scaling (MDS) of the normalized power spectra. Left-hand image, A scatter graph of the first two coordinates produced after classical MDS of each individual larva. In both plots, the circles represent the lowest concentration, the triangles the middle concentration, and the diamonds the highest concentration used for each treatment group. The black square represents the control group. Right-hand image, A scatter graph of the first two coordinates produced after classical MDS of the mean normalized power spectra of each treatment group (see |
Expression Data
Expression Detail
Antibody Labeling
Phenotype Data
Phenotype Detail
Acknowledgments
This image is the copyrighted work of the attributed author or publisher, and
ZFIN has permission only to display this image to its users.
Additional permissions should be obtained from the applicable author or publisher of the image.
Full text @ eNeuro