FIGURE

Figure 2.

ID
ZDB-FIG-220404-15
Publication
Pinion et al., 2022 - Differential electrographic signatures generated by mechanistically-diverse seizurogenic compounds in the larval zebrafish brain
Other Figures
All Figure Page
Back to All Figure Page
Figure 2.

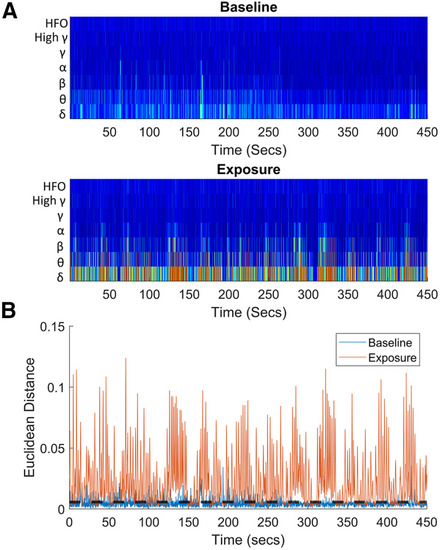
Example data obtained from in vivo electrophysiological recording in a 4-dpf elavl3:GCaMP6s zebrafish larva exposed to 62.5 μM donepezil. A, A representative frequency binned wavelet transformation from a single larva, the top graph shows the baseline and the bottom wavelet transform after drug administration. These transformations were used to identify events from the full timeseries. B, A plot of the Euclidean distance of each time point from the average of the baseline. The black dotted line represents the threshold for selecting events. All peaks above this line were selected and used to find events which were subsequently clustered.

Expression Data

Expression Detail
Antibody Labeling
Phenotype Data

Phenotype Detail
Acknowledgments
This image is the copyrighted work of the attributed author or publisher, and ZFIN has permission only to display this image to its users. Additional permissions should be obtained from the applicable author or publisher of the image. Full text @ eNeuro