FIGURE

Figure 6.

ID
ZDB-FIG-220404-19
Publication
Pinion et al., 2022 - Differential electrographic signatures generated by mechanistically-diverse seizurogenic compounds in the larval zebrafish brain
Other Figures
All Figure Page
Back to All Figure Page
Figure 6.

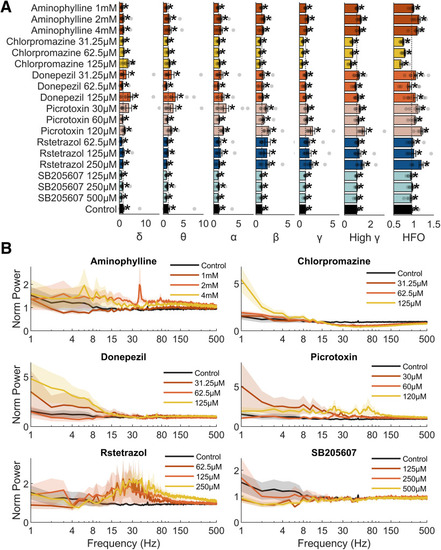
Data generated for larvae exposed to each of the test compounds after spectral analysis and categorization into specific frequency bands. A, The bars show the baseline normalized mean amplitude for each of the neural frequency bands frequently used for categorizing mammalian electrophysiological data (Moffett et al., 2017; Wang et al., 2020). Data are shown as the mean with error bars showing the SEM (n = 7–20). The baseline normalized power for individual larvae are represented by the transparent grey circles. An asterisk indicates a statistically significant difference from control (p < 0.05) using Mann–Whitney U tests and corrected for multiple comparisons using the Benjamini and Hochberg method (Benjamini and Hochberg, 1995). B, Mean baseline normalized power spectra for each compound treatment group. In this case the x-axis is scaled to the common logarithm. Shading represents the SEM for each data point (n = 7–20) across the power spectra. Black lines here indicate the mean of the control animal power spectra and therefore are the same for each graph.

Expression Data

Expression Detail
Antibody Labeling
Phenotype Data

Phenotype Detail
Acknowledgments
This image is the copyrighted work of the attributed author or publisher, and ZFIN has permission only to display this image to its users. Additional permissions should be obtained from the applicable author or publisher of the image. Full text @ eNeuro