
FIGURE
Figure 4.
- ID
- ZDB-FIG-220404-17
- Publication
- Pinion et al., 2022 - Differential electrographic signatures generated by mechanistically-diverse seizurogenic compounds in the larval zebrafish brain
- Other Figures
- All Figure Page
- Back to All Figure Page
Figure 4.
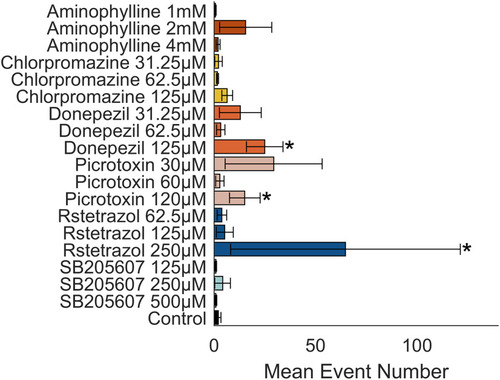
Mean number of events detected per treatment group. Bar graph showing the mean number of events per treatment group. Error bars represent the SEM ( |
Expression Data
Expression Detail
Antibody Labeling
Phenotype Data
| Fish: | |
|---|---|
| Conditions: | |
| Observed In: | |
| Stage: | Day 4 |
Phenotype Detail
Acknowledgments
This image is the copyrighted work of the attributed author or publisher, and
ZFIN has permission only to display this image to its users.
Additional permissions should be obtained from the applicable author or publisher of the image.
Full text @ eNeuro