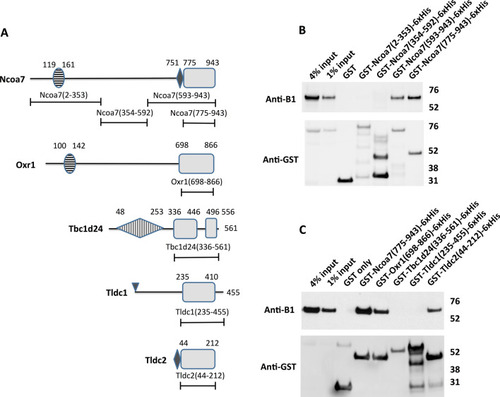
The TLDc domain is sufficient to mediate interaction between TLDc protein family members Ncoa7, Oxr1 and Tldc2 and the kidney-specific B1 subunit of V-ATPase in GST pull-down assay. (A) Schematic representation of domain architecture of the TLDc proteins and constructs used to study the role of the conserved TLDc domain in the interaction with V-ATPase. Boundaries of the domains and constructs are indicated as amino acid numbers, as in the longest known isoform of the corresponding mouse protein. The conserved regions of TLDc domains are shown as grey rectangles, the non-conserved loop in the TLDc domain of Tbc1d24 and C-terminal extensions in the TLDc domains of both Tbc1d24 and Tldc1 are shown as lines. The horizontally striped ovals are LysM domains in Ncoa7 and Oxr1. The small black rhombuses in Ncoa7 and Tldc2 are poly-E rich motifs. The vertically striped rhombus in Tbc1d24 is a TBC domain. The small triangle at the beginning of Tldc1 indicates its site of myristylation. (B) Anti-B1 and anti-GST western blots of a representative GST pull-down assay using the purified GST-tagged N-terminal region of Ncoa7 (2–353), the middle region of Ncoa7 (354–592), the C-terminal region of Ncoa7 (593–943), and the Ncoa7 TLDc domain (775–943) as baits and kidney lysate containing the endogenous B1 subunit of V-ATPase as a prey. Numbers in parentheses indicate the amino acid boundaries of the constructs, based on of the longest known mouse isoform of Ncoa7. This experiment was repeated five times with similar results. (C) Anti-B1 and anti-GST western blots of a representative GST pull-down assay, using the purified GST-tagged TLDc domains of Ncoa7 (775–943), Oxr1 (698–866), Tbc1d24 (336–561), Tldc1 (235–455) and Tldc2 (44–212) and kidney lysate as the source of the B1 subunit of V-ATPase. In both panels (B) and (C) GST only pull-down was used as a negative control; anti-GST blot was used as a loading control for comparison between samples. This experiment was repeated three times with similar results.
|
