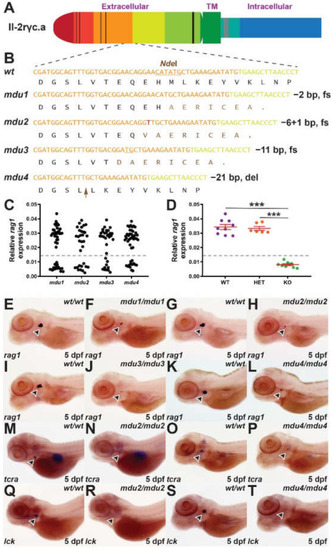
Identification of zebrafish il-2rγc.a mutant alleles and their impact on embryonic lymphopoiesis. (A) Schematic of zebrafish Il-2rγc.a with the extracellular domain, containing cysteine bonds (thin black lines) and a WSXWS motif (thick black line), shown to the left, followed by the transmembrane (TM) domain and the intracellular domain containing Box 1 (thick grey line), with alternate coloring depicting derivation from different exons. (B) Mutant il2rga alleles. Sequence of wild-type (wt) and indicated mutant (mdu) alleles, il2rgamdu1, il2rgamdu2, il2rgamdu3, and il2rgamdu4, along with their impacts at the nucleotide and protein level (fs, frameshift; del, deletion). Nucleotide sequences are colored according to their derivation from exon 3 (orange), exon 4 (yellow), or de novo (red), with the NdeI cut site used for genotyping underlined. The corresponding protein translations are shown below, with wild-type sequence in black and that derived from an alternative reading frame in brown, with the position of the seven residue deletion in mdu4 indicated with the brown arrow. (C–T) WISH analysis. Embryos obtained from in-crossing of heterozygotes carrying the indicated il2rga alleles were fixed at 5 dpf and subjected to WISH with the indicated markers. Expression of rag1 in individual embryos was quantified relative to eye size for each allele (C) (n = 31–46), and a selection of embryos genotyped by NdeI digestion to allow determination of their genotype (WT, wild-type; HET, heterozygote; KO homozygote mutant) (D), showing results for individual embryos, with mean and SEM in red and statistical significance indicated (***: p < 0.001, n = 6–9). Expression of rag1 (indicated with arrowheads) in representative wild-type and homozygous mutant embryos derived from il2rgamdu1 (mdu1) (E,F), il2rgamdu2 (mdu2) (G,H), il2rgamdu3 (mdu3) (I,J) and il2rgamdu4 (mdu4) (K,L), tcra from il2rgamdu2 (M,N) and il2rgamdu4 (O,P) and lck from il2rgamdu2 (Q,R) and il2rgamdu4 (S,T) are shown.