
Figure 3
- ID
- ZDB-FIG-220302-52
- Publication
- Sertori et al., 2022 - Generation and Characterization of a Zebrafish IL-2Rγc SCID Model
- Other Figures
- All Figure Page
- Back to All Figure Page
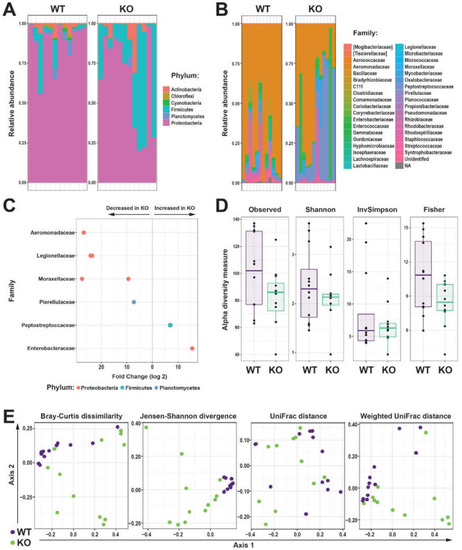
Effect of Il-2rγc.a ablation on intestinal microbiota. (A,B) Relative abundance of bacterial Amplicon sequence variants (ASVs) identified to the taxonomic level of phylum (A) and family (B) in the intestinal microbiome of individual WT (purple) and KO (green) zebrafish. (C) Differential abundances of bacterial family statistically different (p < 0.05) between WT and KO zebrafish, with the direction of change indicated. (D) Alpha diversity of WT and KO zebrafish intestinal microbiome displaying Observed, Shannon, InvSimpson, and Fisher’s indices as box and whisker plots. (E) Beta diversity of WT (purple) and KO (green) zebrafish intestinal microbiome displaying Bray-Curtis dissimilarity, Jensen-Shannon divergence, Unifrac, and Weighted Unifrac of log-transformed relative abundances ordination plots, with each dot representing an individual fish (n = 12 each genotype). |