
Figure 3
- ID
- ZDB-FIG-220302-12
- Publication
- Copmans et al., 2022 - From the North Sea to Drug Repurposing, the Antiseizure Activity of Halimide and Plinabulin
- Other Figures
- All Figure Page
- Back to All Figure Page
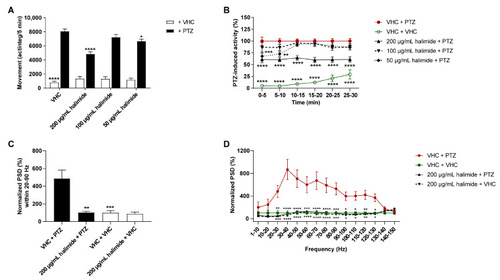
Antiseizure and anti-epileptiform analysis of halimide in the zebrafish PTZ seizure model. Antiseizure activity (A,B) and anti-epileptiform activity (C,D) of halimide in the zebrafish pentylenetetrazole (PTZ) seizure model after 2 h of incubation. (A,B) Behavioral data is expressed in mean actinteg units per 5 min (±SEM) during the 30 min recording period (A) and over consecutive time intervals (B). Data is normalized against the vehicle (VHC) + PTZ control condition (B). (C,D) PTZ-induced epileptiform brain activity and the anti-epileptiform effect of 200 µg/mL halimide recorded via non-invasive local field potential recordings. Electrophysiological data is normalized against the VHC + VHC control condition and expressed as normalized power spectral density (PSD) (mean ± SEM) per larva within the 20–90 Hz region (C) and as normalized PSD (mean ± SEM) per larva per 10 Hz frequency band from 1–150 Hz (D). (A,B) Data are pooled from five independent experiments with each 6–11 replicate wells per condition: VHC + PTZ (n = 53), compound + PTZ (n = 52–53), VHC + VHC (n = 53), and compound + VHC (n = 41). (C,D) Number of replicates per condition: VHC + PTZ (n = 17), VHC + VHC (n = 13), halimide + PTZ (n = 11) and halimide + VHC (n = 12). Statistical analysis: (A,C) one-way ANOVA with Dunnett’s multiple comparison test, (B,D) two-way ANOVA with Dunnett’s multiple comparison test, (C,D) outliers were removed via the ROUT test (Q = 1%) (GraphPad Prism 9, San Diego, CA, USA). Significance levels: * p ≤ 0.05; ** p ≤ 0.01; *** p ≤ 0.001; **** p ≤ 0.0001. |