
Figure 8.
- ID
- ZDB-FIG-211201-251
- Publication
- Montijn et al., 2021 - A parameter-free statistical test for neuronal responsiveness
- Other Figures
- All Figure Page
- Back to All Figure Page
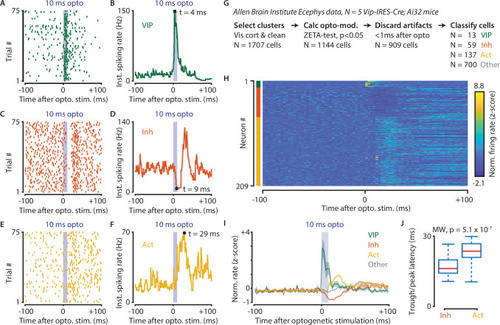
(A–F) Response of example cells classified as VIP (A,B), Inhibited (C,D) and Activated (E,F). (G) Data were recorded in visual cortex from 5 Vip-Cre mice at the Allen Brain Institute. Cells were only included if the clustering quality was sufficient (1707 cells total). A ZETA-test included cells that were modulated within (–0.5, + 0.5 s) after optogenetic stimulation (N = 1144 cells). IFR peak- and trough-latency was computed and cells were discarded if their peak was earlier than 1 ms after optogenetic stimulation onset. Remaining cells were classified as VIP (N = 13), Inhibited (N = 59), Activated (N = 137), or Other (N = 700). (H) Heat map showing normalized firing rate of VIP (top), Inhibited (middle), and Activated (bottom) cells. (I) Mean ± SEM of PSTH (2.5 ms bin size) over all VIP (green), Inhibited (orange), Activated (yellow), and Other (gray) cells. (J) Inhibited cells showed significantly lower mean IFR-peak latencies after optogenetic stimulation than Activated cells (Inh: 17.4 ms; Act: 23.0 ms; Mann-Whitney U-test, p = 5.1 × 10⁻⁷).
|