
Figure 4.
- ID
- ZDB-FIG-211201-246
- Publication
- Montijn et al., 2021 - A parameter-free statistical test for neuronal responsiveness
- Other Figures
- All Figure Page
- Back to All Figure Page
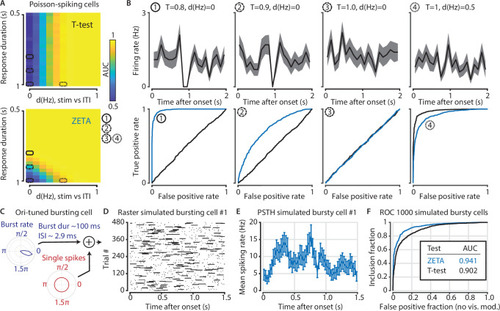
(A) Top: the ability of the t-test to differentiate simulated stimulus (non)modulated cells depends only the total spike count during stimulus (0–1 s) and inter-trial interval (ITI, 1–2 s) periods (x axis; firing rate difference d(Hz)), but not on the duration of the cell’s response when keeping the spike count constant (y axis; response duration T). Bottom: in contrast, the ZETA-test can differentiate stimulus modulation using either variable. (B) Top: example PSTHs of single cells corresponding to the markers 1–4 in (A). Bottom: ROC curves for the combination of variables marked as 1–4 in (A). The ZETA-test always exceeds the t-test’s performance, except for a limited range where the response duration is 1 s. (C) A more biologically plausible test case is bursting neurons that have an elevated probability of bursting during stimuli. (D–E) This simulation produces no ‘onset’ peaks of activity that the ZETA-test can exploit. (F) However, despite the lack of clear peaks of activity, the ZETA-test exceeds the t-test’s ability to detect stimulus-modulated bursting cells (ZETA AUC = 0.941, t-test AUC = 0.902).
|