
Figure 5.
- ID
- ZDB-FIG-211201-247
- Publication
- Montijn et al., 2021 - A parameter-free statistical test for neuronal responsiveness
- Other Figures
- All Figure Page
- Back to All Figure Page
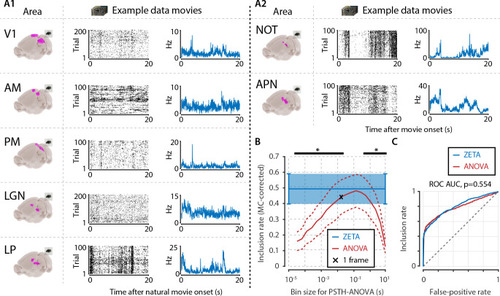
(A) We recorded neuronal responses to natural movies (four scenes that repeated every 20 s) from various visual brain areas: V1, AM, PM, LGN, LP, NOT, and APN. For each area, we show an example neuron’s raster plot (left) and binned responses (right). All cells depicted here were significant using ZETA. (B) We determined a neuron’s responsiveness using a 1-way ANOVA over all binned responses (i.e. PSTH-level ANOVA) for various bin sizes and MC-corrected (black) and using the ZETA-test (blue). Note that the ZETA-test is timescale-free and plotted at all x-values only for easy comparison with the ANOVAs. Curves show mean ± SEM over brain regions (n = 7). ZETA shows an inclusion rate similar to the most optimal bin sizes (0.0333s – 0.2667s), and significantly higher than bin sizes of 0.0167 s or shorter, as well as 0.533 s or longer (*, FDR-corrected paired t-tests, p < 0.05). (C) An ROC analysis on all n = 977 cells showed that the ZETA-test and a combined set of ANOVAs were similarly sensitive (ZETA-test AUC: 0.792 ± 0.011; ANOVAs AUC: 0.798 ± 0.010; z-test, p = 0.554).
|